
Of all the industries we monitor at CIM, the most closely followed is banks. Their relevance to us is twofold: one, at a macro level they provide valuable and timely intelligence about the state of the real economy and two, they tell us where their constraints and opportunities around lending are, informing our opportunity set in private lending markets.
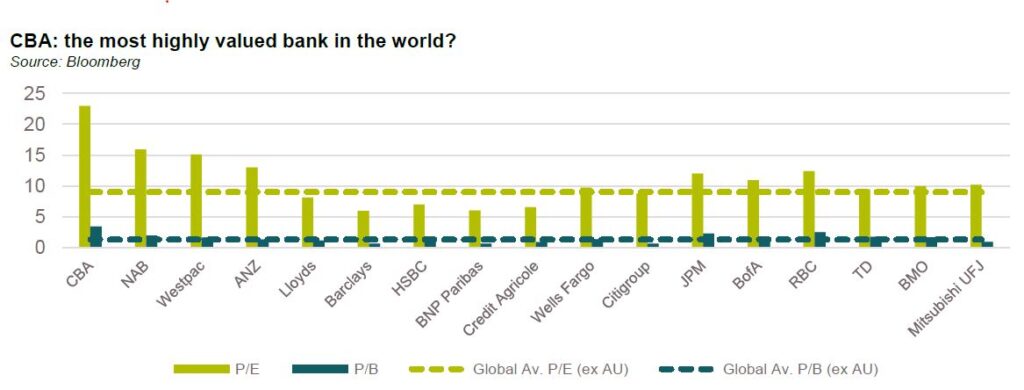
We’ve discussed previously how US bank lending standards are a leading indicator for defaults[1] but this month we are going to take a deeper dive into bank reporting season with a specific goal of contrasting US bank results to our Australian champion, CBA. Much has been written about how CBA might be the most highly valued bank in the world (see chart below) and it feels timely to consider how some of CBA’s fundamentals compare with their offshore peers.
For US banks loan growth was flat in 2Q24 compared to -3% in 1Q24. This came largely as a result of declining commercial real estate (CRE) exposures which were down 3% for the quarter, in line with 1Q24. Residential loan growth also came in negative, down 2% which was in line with the prior quarter. Offsetting declines in CRE and residential were increases in commercial lending and credit card exposures which were up 1% and 2%, respectively.
On the liability side, deposits decreased 2% over the quarter with declines in both consumer and corporate deposits. This, along with the rising credit card balances is an indicator that the higher interest rate environment is placing pressure on households. In contrast with the rest of the world, the US financial system has a vibrant money market fund industry which draws household deposits away from the banks. Money market fund assets were up 1% over the quarter hitting US$6.1 trillion at 30 June 2024 (note this compares with US$16.2 trillion in total domestic deposits at US commercial banks).
In terms of underlying performance of loan portfolios, Goldman Sachs research reported that the net charge-off rate was 0.68% in 2Q24, higher than the COVID peak of 0.61% from 2Q20, up 0.45% from the COVID low and up 0.14% over the 2012-19 average. According to Goldman net charge-offs are above long term averages across all categories except mortgages.
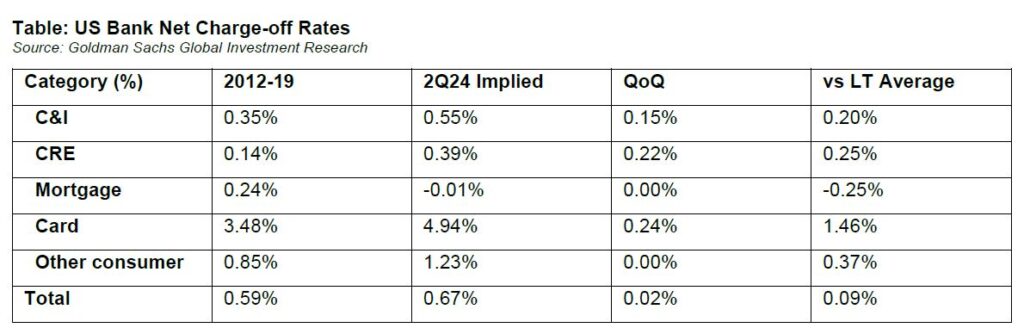
Notably despite the headlines around commercial real estate, charge-off rates remain well below historical peak levels. According to the US Federal Reserve the charge-off rate on CRE loans peaked at 3.1% in Q42009 and 2.5% in Q41991. Even the charge off rate on credit cards remains well below the GFC or the prior peak of 7.65% in Q12002. Charge-off rates are rising but not at a sufficiently fast pace to warrant more material concerns regarding asset quality. Guidance from the banks was for consumer net charge-offs to stabilise in the second half of 2024.
CBA saw strong loan growth over the quarter with corporate and residential mortgage exposures both increasing. Commercial property exposure was also up over the half. The only notable area where loan growth was negative was lending in New Zealand. Consumer lending was also flat over the half.
On the liability side CBA experienced much slower growth in deposits over the 6 months ended June 2024. Household deposits were up 1.1% in the six months to June, with year on year growth much stronger at 5.4%. This was slower growth than system which was up only 1.6% for the half and 7.2% for the year. Business deposits fared worse, flat for the half and actually down 0.6% for the year. CBA attributed strong deposit price competition to contributing to a contraction in margins which were down 8 basis points for the half.
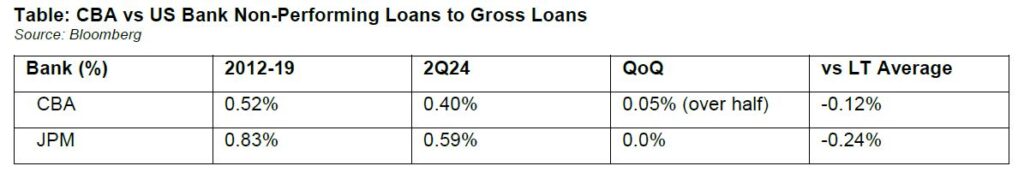
In terms of asset quality CBA saw rising delinquencies across home loans, personal loans and credit cards with personal loans moving above the historical averages from August 2008- June 2023. Troublesome and impaired assets were 0.63% of total committed exposures, up from 0.49% in December 2023 but still well below pre-COVID levels of 0.72%. The loan impairment expense of 9 basis points was down 3 basis points from FY23, remaining at very benign levels. In New Zealand the loss rate was even better at only 6 basis points. The quality of CBA’s overall commercial lending portfolio has continued to decline with 64.7% rated investment grade, a 4.6% decline over the year and 3% decline over the half.
The key area of focus for both US and Australian banks is commercial property. As discussed above, CBA’s exposure to commercial property actually increased over the half even as portfolio quality declined. Total exposure is A$94.9 billion, 6.9% of total committed exposure. This exposure is much lower than CRE exposure within even the larger US banks with only Citigroup having less exposure on a percentage basis than CBA. With CRE, provisions were 0.5%, higher than US banks (at 0.4%), with 1.3% of the portfolio graded troublesome or impaired and 36.1% rated investment grade. All are moving in the wrong direction.
Exposure to the construction sector, an even more challenged (albeit much smaller at only 1% of total committed exposure) sector also increased. Both this and the increase in commercial property exposure is counterintuitive and suggestive of a lender that is providing flexibility for borrowers to manage their way through a difficult environment rather than an active decision to increase exposure.
With Australia’s rate hiking cycle being behind the United States several trends from the US are likely to emerge down under:
- Slowing loan growth;
- Higher share of troublesome and impaired assets; and
- Margin pressure.
To be clear, none of this is remotely existential and furthermore, there is nothing really to suggest that CBA is even going to approach the minimal levels of stress currently being experienced by US banks. Indeed, outside of commercial real estate and construction exposure and New Zealand, there is little to be concerned about.
To go full circle, the strength of CBA’s balance sheet is a signal to the RBA that they should not be considering rate cuts in 2025.
And that might be the most important takeaway of all.
[1] https://www.challengerim.com.au/what-were-watching-what-is-the-feds-senior-loan-officer-survey-and-what-is-it-telling-us/