What We’re Watching: Our quarterly review of markets – December 2022
January 2023
Non-Financial Credit:
Summary views: the domestic corporate bond market continues to shrink which is holding pricing tighter than offshore. Private markets look attractive on a relative basis with additional diversification benefits though supply here has also been muted.
The December quarter saw a rebound in credit markets which ended the year 15-25% inside of the wides of the year. The most material underperformer was the Australian credit market which continues to lag. Over the last few years however, Australia investment grade credit has performed well with spreads only 27 basis points wider over the last few years versus US investment grade credit which was 66 basis points wider (albeit with much longer spread duration) and European investment grade credit which was only 17 basis points wider (in local currency terms, cross currency basis would make the move more like 40 basis points in AUD terms).
We have previously highlighted the relative illiquidity of the Australian bond market. The lack of supply only adds to these issues and suggests to us that spreads domestically may have lagged the widening in offshore markets.
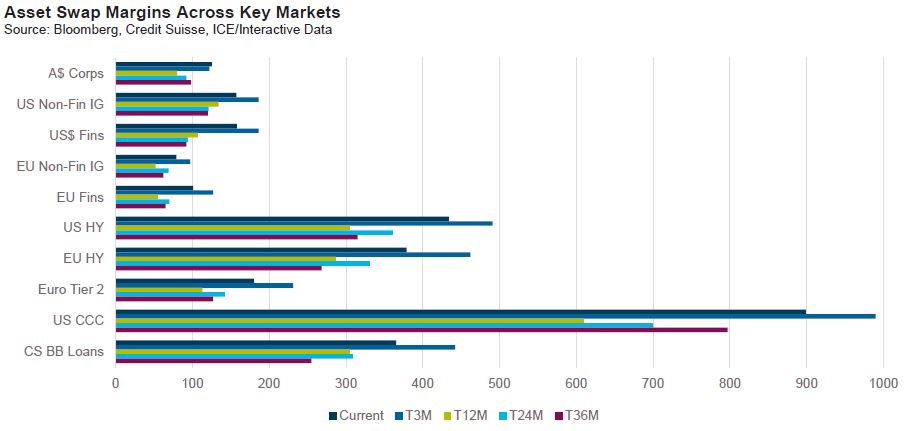
From a fundamental standpoint, there is little to highlight domestically yet. Corporate earnings are backwards looking but there has been a reasonably sharp uptick in companies entering administration; the trailing 12-month figure was close to 6,500 up from around 4,000 at the lows but still well below pre-COVID averages of 8-10,000. However, looking offshore for more timely information we are observing some negative trends. Excluding COVID, the Fed Loan Officer Survey reports the most significant tightening in lending standards for large loans since the Global Financial Crisis.
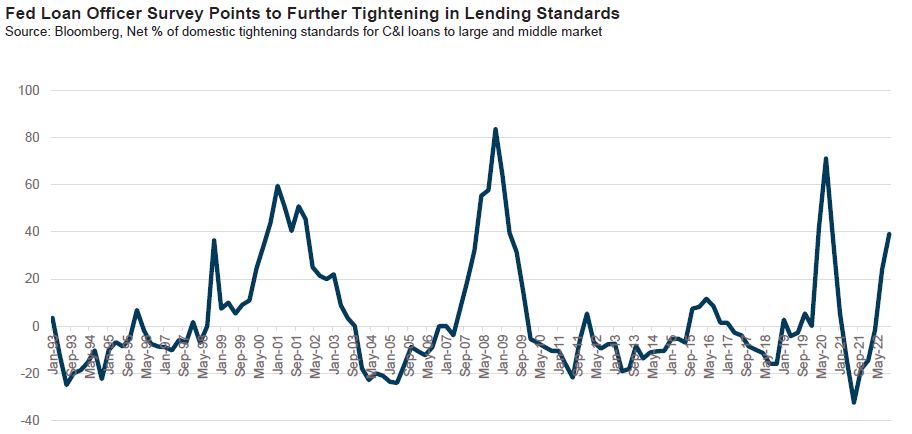
Interestingly we noted a report by provided by Golub which showed that despite the tightening lending standards, financial performance was strong in the US middle markets with YoY revenue and earnings around coming in at around 10% through November 2022, only slightly down on the Q2 and Q3 numbers. The weakest sector was Healthcare with earnings coming in flat with the strongest growth coming from Technology. Again, we would highlight that we are still early. Loan only borrowers are likely to feel the brunt of the impact of higher rates in coming months and so the bulk of the pain is likely in front of us. Morgan Stanley research echoed this comment, highlighting that loan LTM interest expense increases are approaching EBITDA growth with earnings slowing and interest expense increasing. This effectively implies reductions in free cash flow are coming for the loan market.
Reflecting these negative fundamental themes are the rating agencies. Negative rating actions are accelerating with downgrades strongly outpacing upgrades in the loan market and virtually all of the net upgrade activity from 2021 being wiped out.
From an issuance standpoint, volumes in domestic markets continue to be anemic. Total issuance for the year plumbed all time lows as borrowers continued to take comfort in the warm embrace of the bank loan market where total non-financial loans increased by close to 13% over the year.
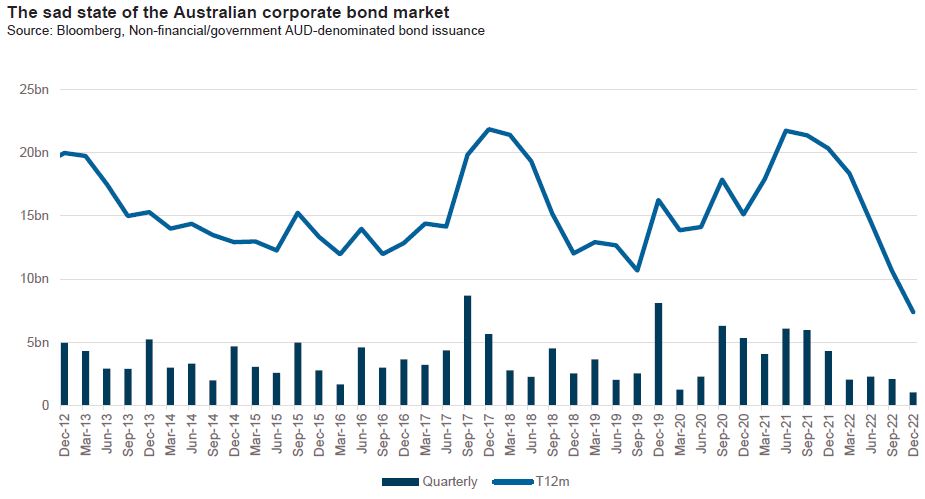
The domestic corporate bond market was not alone in terms of net supply numbers with the US high yield bond market shrinking in 2022 and leveraged loan supply down 63% from the 2021 record.
Activity in private corporate markets was down as well but not by nearly as much as corporate bond markets. M&A activity continued to slow in the Dec 22 quarter, amid global macro concerns of high inflation, interest rate hikes, recession fears and geopolitical uncertainty. There were a few bank-led debt financing transactions executed in the Australian market with borrowers largely struggling to accept new normal pricing from institutional lenders who are more guided by relative value offshore. These bank-led deals include:
- IFM and UniSuper’s acquisition of radiology business PRP Diagnostic Imaging, supported by a $300m+ traditional bank debt package underwritten by three banks.
- Quadrant Private Equity’s acquisition of Aidacare, a supplier and distributor of healthcare and mobility equipment. In a similar vein, Next Capital completed its acquisition of Country Care Group, a distributor to the assisted living and aged care sectors.
- Anchorage Capital Partners’ acquisition of David Jones, an Australian department store chain. The transaction was supported by debt packages provided by domestic banks and restructuring debt specialist funds.
The story for 2023 will really depend on what happens in the bank market. As we have noted, contrary to the popular narrative domestic banks were very aggressive in extending credit in 2022. As funding costs increase, capital becomes scarcer and credit quality deteriorates, our view is that they follow the US banks and tighten the availability of credit. This should lead to a moderate increase in both the private and public opportunity set.
Financial Credit:
Summary views: financials look cheap to corporates, but greater extension risk needs to be priced in due to APRA’s focus on non-economic calls. Story is all about supply with the sector in a strong capital and liquidity position.
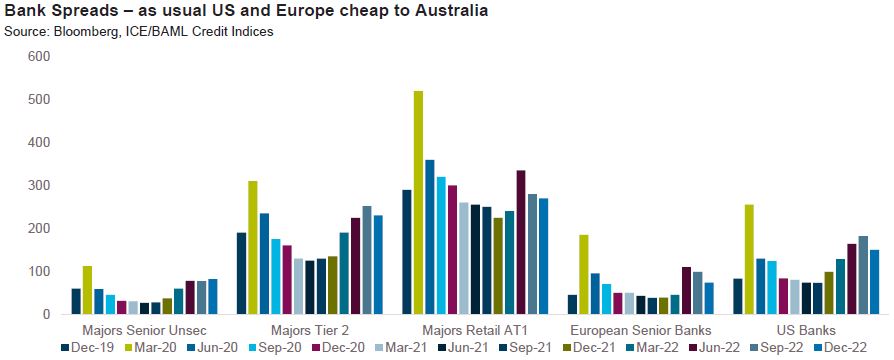
All financial subsectors tightened in Q422 except senior unsecured paper. When different parts of the same capital stack move in different directions, we start to look at supply dynamics and it appears to be the case here in Australia.
As we show below issuance volumes were down in Q4 but are still elevated relative to the pre-COVID period. Banks are still accruing positive deposit flows, but these are not offsetting lending growth leading to an increasing funding gap which will require alternative sources of funds. We expect lending growth to slow but equally think deposits flows will moderate and as such expect the funding gap to persist. As such, debt capital should remain elevated into 2023.
Looking at the major banks only, CBA expects total long term wholesale issuance of A$125-$145 billion. Underlying this expectation is an assumption of a funding gap of A$20bn, Term Funding Facility repayments of A$105 billion and $80 billion in maturities in 2023 of which A$40 billion was pre-funded. We fear this expectation may turn out to be low given the funding gap in just the last three quarters (through November 2022) was $18 billion, implying a potentially much larger annualised gap in 2023.
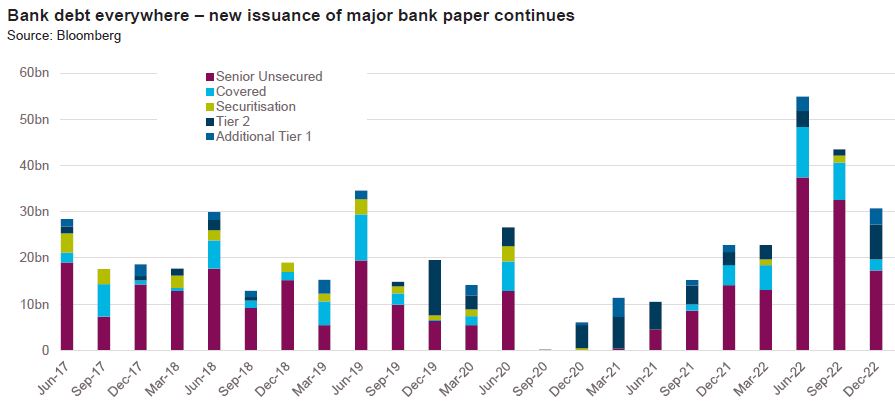
Asset quality within the domestic banking sector remains very strong with no signs of deterioration. Offshore there are signs of a moderate deterioration. JPMorgan reported Q422 annualised net charge-offs of 0.32%, up from a low 0.2% in Q321. All COVID provisions have been unwound meaning any further deteriorations will weigh on profitability albeit with capital and liquidity at very robust levels, the banks are well positioned to face a recessionary environment.
Further as we have previously noted, banks have leverage to higher rates and so are arguably more resilient to a higher interest rate environment than other sectors. It is interesting that despite a better fundamental credit story valuations do look attractive relative to corporate paper. Financial spreads in Europe and the United States currently trading at 120-130% of their pre-COVID average level while corporates are at 110-120% of their pre-COVID averages.
Across the capital structure, the standout news was APRA’s statement which warned over a greater level of focus around the uneconomic calls of capital instruments. The immediate reaction to the announcement was a sharp widening in Tier 2 spreads with the retail hybrid market barely acknowledging the news. As it stands today, spreads have more than retraced the moves wider as several marginal Tier 2 calls have taken place, with the market interpretation seemingly that calls will still occur except in the most exceptional of circumstances.
Our view is that there is still a significant amount of water to go under the bridge and that markets are too sanguine based on too little data, particularly in the perpetual Additional Tier 1 market. For this reason, despite the relative value favouring financials over corporates, we are cautious and adding securitised debt in favour of financial.
ABS & Whole Loans:
Summary views: moving from negative to positive on supply technicals but becoming more negative on fundamentals. Valuations look cheap on a relative basis.
We enter a new year with several conflicting themes emerging.
The first relates to significant change in the flow of credit coming from banks versus non-banks. At an aggregate system level, bank share of total lending dropped from a peak of 92.38% at the end of Q1 2022, to 92.01% at November 2022 and is now the lowest since 2012/13. However, the anecdotes we are hearing from the market are very different.
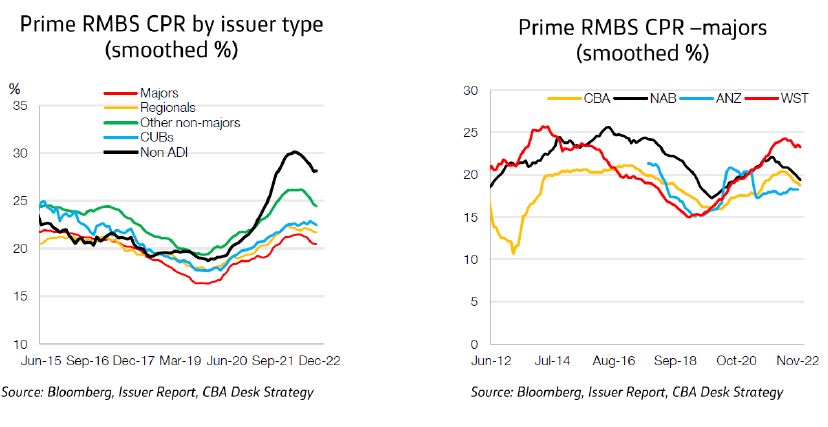
One large non-bank lender spoke to prime residential mortgage volumes being down 80% from peak levels with non-conforming down by around 50%. All report market share is being lost to the banks on mortgages. Add to this extraordinarily high prepayment speeds which resulting in books shrinking extremely quickly. While speeds have moderated as per the below charts from CBA, it’s clear that non-banks continue to experience much faster prepayment speeds than non-banks.
A similar story could be told in the UK albeit perhaps not as extreme. There prepayment spreads are well into the 75th percentile but remain much slower than Australia.
And even at an aggregate level credit is rolling over. As shown below loan commitments are currently down 26% from their peak and annualising declines at more like 40%. Even with these declines already baked in, new loan commitments are still above pre-COVID levels, suggesting that there may be further to go.
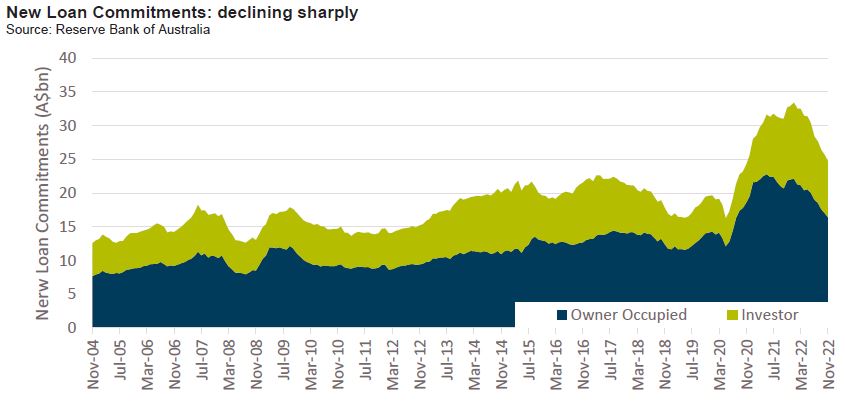
Total domestic supply ended the year at just under $50 billion and was the third largest issuance year (behind 2021 and 2017). However, due to sharply declining loan commitments, the move from non-bank lenders to bank lenders and fast prepayment speeds, all suggest that gross and net issuance could surprise to the downside in 2023, which of course would be positive for credit spreads.
Conflicting with the theme of stronger technical is that of weaker fundamentals. Notably there is little evidence of weakening fundamentals in the Australian market. Arrears remain anchored at close to historical lows reached earlier in 2022 across both mortgage and non-mortgage securitisations. However, with a more global perspective (which are arguably ahead of Australia in their respective tightening cycles), there is a clear upward trend.
In US asset backed markets all sectors experienced an increase in delinquencies as we show below. Weaker credits such as personal loans and subprime auto have already increased above pre-COVID levels.
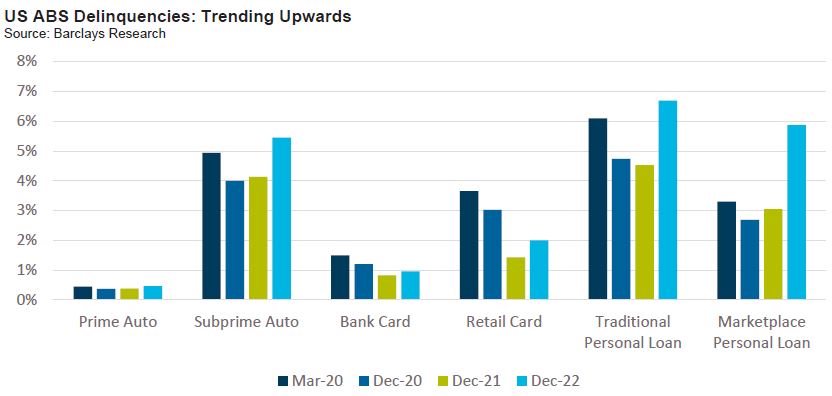
We fully expect domestic markets to follow the trends experienced offshore and start to increase as consumers are impacted by higher interest rates and lower asset values.
Thus, in direct contrast to previous quarters we are positive on technicals and negative on fundamentals.
In the spirit of the old investing quote, “there are no bad assets, just bad prices”, the final and most important consideration is valuation. Over the quarter primary market valuations moved slightly wider in domestic markets which is in contrast to what occurred offshore and in financial debt. In large part this reflects the illiquidity of the domestic securitisation market and the lagged impact of the widening from the third quarter. Indeed, secondary market activity would imply a similar level of tightening to what was experienced in offshore and financials.
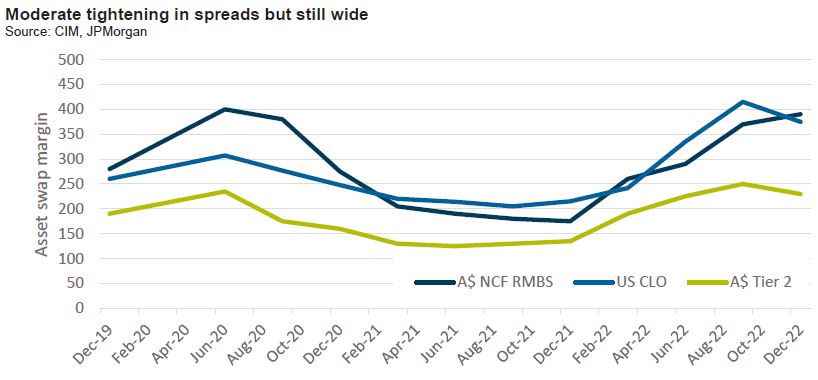
Notwithstanding the move in spreads over the quarter, domestic securitised spreads do look wide on a relative basis. The pickup over Tier 2 is significant and spreads on domestic securitised issuance is again coming wider that similarly rated Collateralised Loan Obligations.
Real Estate Loans:
Summary views: as fundamentals weaken, expect more lending to flow from banks to non-banks. Increased supply should create opportunities though caution is certainly warranted.
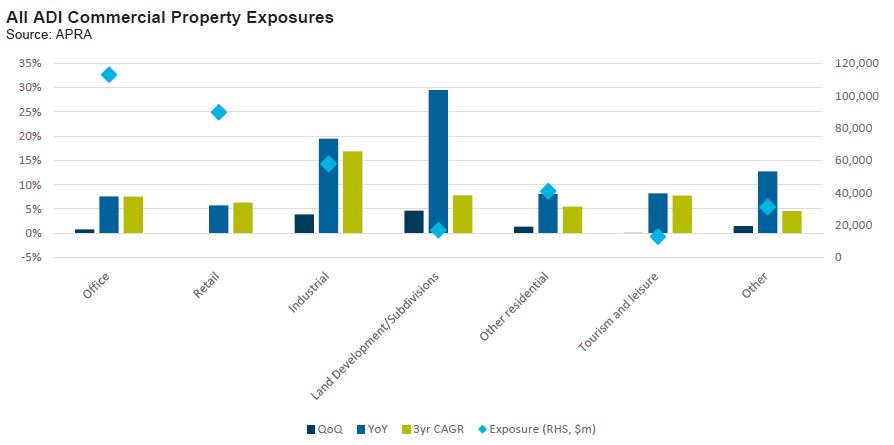
APRA data through the September 2022 quarter showed commercial property exposure limits for ADI’s continue to increase ending at $417.1b ($362.0b drawn), a 9.5% annual growth rate. The major banks commercial property market share is 73% (down by 2% on previous corresponding period). Major banks have grown their commercial property exposures by 9% over the last 12 months (and virtually zero in the Sep-22 quarter) while foreign branch banks grew at 21% for the year and 4% for the quarter. Lending growth is definitely slowing rapidly with the quarter-on-quarter growth the slowest since the Mar-21 quarter.
At a sector level the fastest growth came from Industrial and Land development/subdivisions. Growth in both sectors was driven by foreign branch banks which is a somewhat new development. Currently 16% of the foreign branch bank commercial property loan portfolio is Industrial or Land development/subdivisions but these two sectors were 37% of the growth in exposures during the September quarter. Whether this is a case of new risk appetite from foreign branch banks or a case of major banks stepping back from these markets is an open question. Time will tell.
At a fundamental level, commercial property looks likely to come under further pressure as cap and discount rates widen in response to the higher yield curve. Domestically, CBD office vacancies remain at or close to peak levels for both prime and secondary grade assets. Rental growth has been under pressure. Speciality retail rental growth continues to go backwards with national vacancy rates at around 7%. Industrial property remains a bright spot with very low vacancies albeit supply coming to market is significant in the coming year.
Despite these trends and long-term interest rates increasing by 2-2.5%, asset valuations have remained robust. Using Charter Hall as an example, December valuations were up 0.5% with only office down (and then only down 0.5%) despite pricing at a mid-teens discount to NAV (contrast with Dexus which trades at a mid-30s discount to NAV). A lack of transactional activity has likely delayed any reductions in valuation though that is likely to change through 2023.
Offshore we are already seeing cap rates increase but only moderately so. According to JPMorgan US transaction cap rates bottomed at 5.3% and have increased to 5.9% as at November 2022. As is the case in Australia, transaction volumes are down significantly, close to 80% on a year-on-year basis. With US yields up by roughly the same amount as Australia and credit spreads 75-100 basis points wider, it would seem further increases in cap rates are inevitable. Indeed, in the US listed REITS went from trading at close to a 20% premium at year end 2021 to a mid-teens discount at year end 2022.
Similarly in the UK according to the CBRE index commercial property capital values were down 13.3% in 2022, a sharp turnaround from 2021 when valuations were up 13.8%. With capital values down 3% in December alone and 14.6% in the last quarter of 2022, the trend is pointed to sharper declines in 2023.
A major investment theme for us is that Australia is lagging the rest of the world by 6-12 months in terms of the economic cycle. While in general Australia should outperform it is not immune from the pressures faced offshore. Commercial property values have to decline here which for alternative lenders is as much an opportunity as a risk. Declining property valuations combined with pressure on interest coverage ratios will push more loans which currently sit with banks into the non-bank lending sector. Equally, any non-bank lending which took place based on 2021/early 2022 levels of interest rates and valuations is likely to face some degree of stress.
On behalf of the team thanks for reading.
Pete Robinson Head of Investment Strategy – Fixed Income
Unless otherwise specified, any information contained in this material is current as at date of publication and is provided by Challenger Investment Partners Limited (Challenger Investment Management or Challenger) (ABN 29 092 382 842, AFSL 234678), the investment manager of the Challenger IM Credit Income Fund ARSN 620 882 055 and the Challenger IM Multi-Sector Private Lending Fund ARSN 620 882 019 (the Funds). Fidante Partners Limited ABN 94 002 835 592, AFSL 234668 (Fidante) is the responsible entity and issuer of interests in the Fund. Fidante and Challenger Investment Management are members of the Challenger Limited group of companies (Challenger Group). Information is intended to be general only and not financial product advice and has been prepared without taking into account your objectives, financial situation or needs. You should consider whether the information is suitable to your circumstances. The Fund’s Target Market Determination and Product Disclosure Statement (PDS) available at www.fidante.com.au should be considered before making a decision about whether to buy or hold units in the Fund. Past performance is not a reliable indicator of future performance.
Fidante and Challenger Investment Management are not authorised deposit-taking institutions (ADI) for the purpose of the Banking Act 1959 (Cth), and their obligations do not represent deposits or liabilities of an ADI in the Challenger Group (Challenger ADI) and no Challenger ADI provides a guarantee or otherwise provides assurance in respect of the obligations of Fidante and Challenger Investment Management. Investments in the Fund are subject to investment risk, including possible delays in repayment and loss of income or principal invested. Accordingly, the performance, the repayment of capital or any particular rate of return on your investments are not guaranteed by any member of the Challenger Group.
