
Over the past few months, we’ve been puzzled by the strength of the bullish tone around house prices. Puzzled because the argument supporting house prices seems to be hanging on the lack of supply/strong migration creating a supply demand imbalance.
Most other factors seem to be flashing warning signals. Consider:
- House price valuations relative to incomes are at record high levels in Australia, around 11 times and higher even than Canada and Sweden according to Morgan Stanley;
- Negative sentiment with Westpac survey data indicating that less than 10% believe real estate is the wisest place for their savings down from close to 30% in the mid 2010s;
- Rental yields relative to cash rates are negative despite strong rental inflation;
- Increasing mortgage arrears rates (albeit from a low starting point);
- Share of housing finance extended to investors is at the highest share since 2017;
- Tighter credit standards; less interest only, increased serviceability buffer combining with higher interest rates. Barrenjoey estimates that from 2017 maximum borrowing capacity from CBA has declined by 30-40%; and
- Over 20% of borrowers with loan servicing ratios more than 30%, up from 5% of borrowers back in April 2022.
With all these negative indicators we are heavily reliant on the housing supply/demand argument holding up house price valuations. So how confident are we in the supply/demand imbalance?
The first indicator for low supply seems to be the lack of vacant rental housing. Pre-COVID vacancy rates were around 2.5%, close to 20 year peaks. When COVID hit, vacancy rates spiked then declined sharply as household formation rates plummeted.
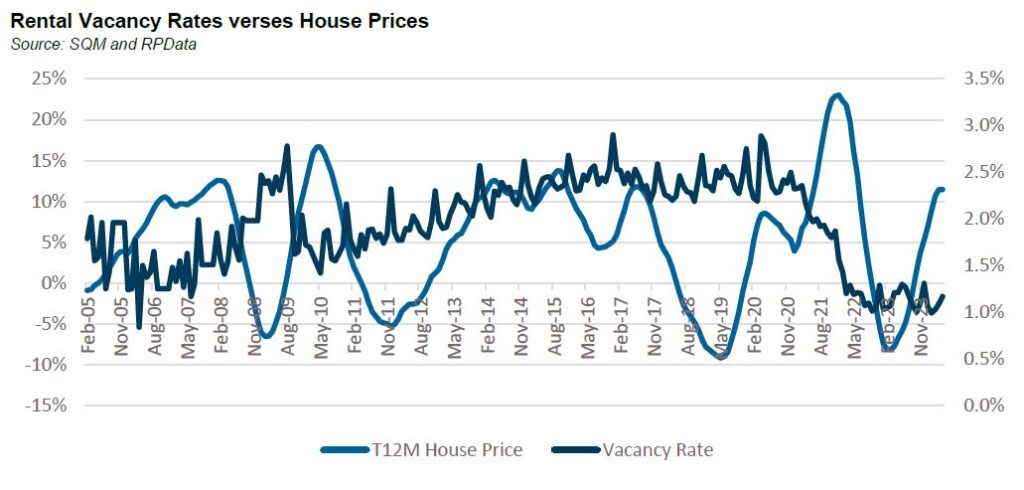
However, the relationship between vacancy rates and house prices does not appear to be as strong as the headlines suggest[1]. Coming out of the GFC, house prices rose strongly even as vacancy rates increased. For much of the 2010s vacancy rates were rangebound between 2-3% but in the second half of the decade prices began to decline. In fact, the last time vacancy rates were this low, it was prior to the GFC.
When a vacancy rate of 1% is quoted, it’s calculated as a percentage of total rental stock, not total housing stock. Total housing stock is c. 11 million units compared to rental stock of 3 million. To put in context the decline in the vacancy rate from March 2020 to current is equivalent a reduction of around 30,000 dwellings.
Contrast this figure with the amount of unoccupied houses which was over 1 million on the night of the 2021 census of which 10,000 dwellings were completely vacant, 100,000 were secondary dwellings with the remaining 890,000 being primary dwellings which were empty. Historically there has always been around 10% of total housing stock that is unoccupied at any point in time.
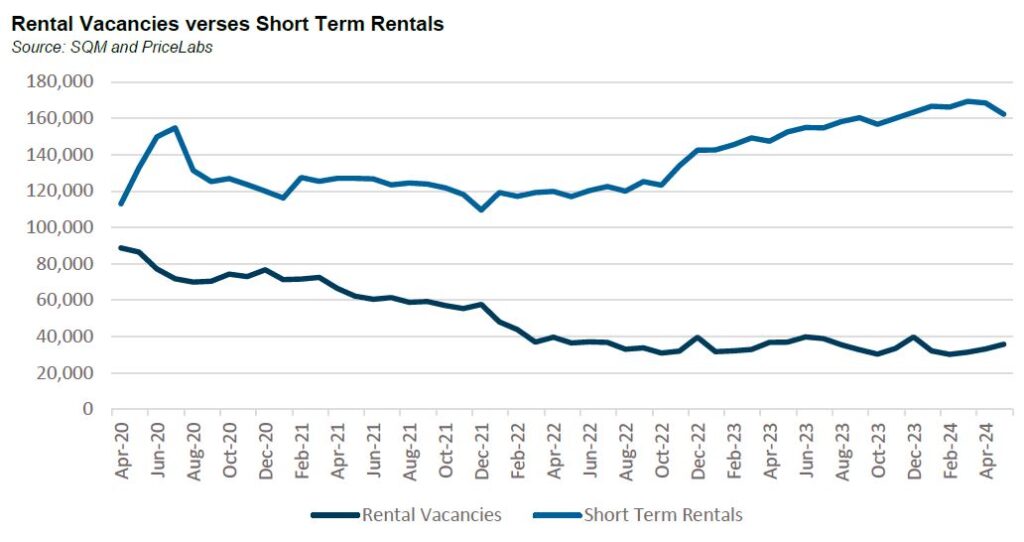
Related to this are short term rentals. These do not show up in the rental vacancy statistics mentioned above but according to PriceLabs, a site which tracks short term rentals, listings are up by close to 50,000 since the start of COVID. It’s not unreasonable to assume that some of the rental stock taken out of the market has moved into the short term rental market.
The question is, could it come back?
Having rebounded strongly post COVID RevPAR[2] is down slightly on a year over year basis. With interest rates higher, the economics of short term rentals (and for that matter, long term rentals) is under pressure. Add to this, increases in land taxes for investors in Victoria plus an upcoming levy of 7.5% to be charged for short term rentals which is to be charged from 2025.
It’s not inconceivable that as financial conditions tighten, supply could come out of existing stock, either via second houses or short term rentals.
On the supply side, it is clear that the government’s target of building 1.2 million homes in 5 years is not happening. The National Housing Supply and Affordability Council estimated in May that around 903,000 dwellings would be built with a further 40,000 social and affordable dwellings built, figures that appear to be far more achievable. But they also expect demand to stabilise with around 871,000 new households forming as migration normalises. So, looking forward we don’t seem to have a major housing supply issue.
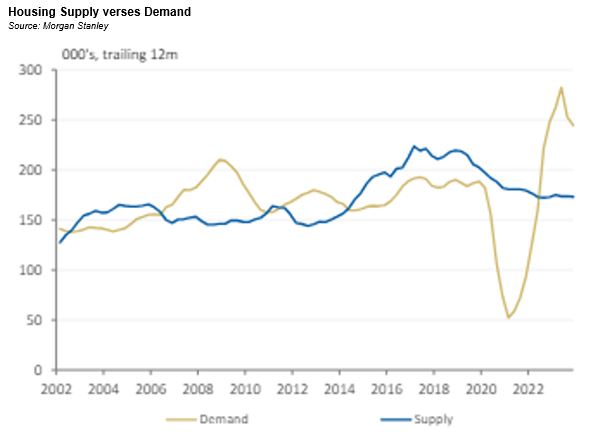
The question is whether we are grossly under supplied now. The below chart from Morgan Stanley attempts to answer this. It shows that we were undersupplying during the GFC and early 2010s and oversupplying from around 2015 until 2022 from which point the housing market became historically undersupplied. In fact, it is arguable that we are undersupplied right now; our view is that the market is extrapolating incremental demand exceeding incremental supply into a more significant and permanent imbalance than likely exists[3].
So, what does this all mean?
We think the supply-demand argument is overbaked. The state of the housing market has much more to do with the amount of stimulus and lagged effect of interest rate increases than migration and construction. As the economy goes so too does the housing market.
Already house prices in New Zealand and the United Kingdom, two markets with very tight supply demand characteristics, are declining. House prices in Canada are flat and slowing in the United States. House prices have had a strong run in Australia, but we expect some normalisation over the second half of 2024.
[1] Academic research has shown there is a relationship between rental vacancy rates and rents and then a relationship between rents and house prices. Our view is simply that there are much more important factors at play driving house prices such as real incomes, interest rates, sentiment and asset prices.
[2] RevPAR refers to Revenue Per Available Room. It is a standard acronym within the hotel sector and is used within the short term rental market.
[3] We haven’t discussed migration in this piece and instead relied on the NHSAC estimates for new household formation. Suffice to say migration is a highly politicised issue and risks are likely to the downside given the rhetoric from both sides of the aisle.