
Non-Financial Credit:
Summary views: rally in public market spreads has reduced the appeal, particularly in high yield. Illiquidity premiums remain elevated, mainly due to the strength in public markets.
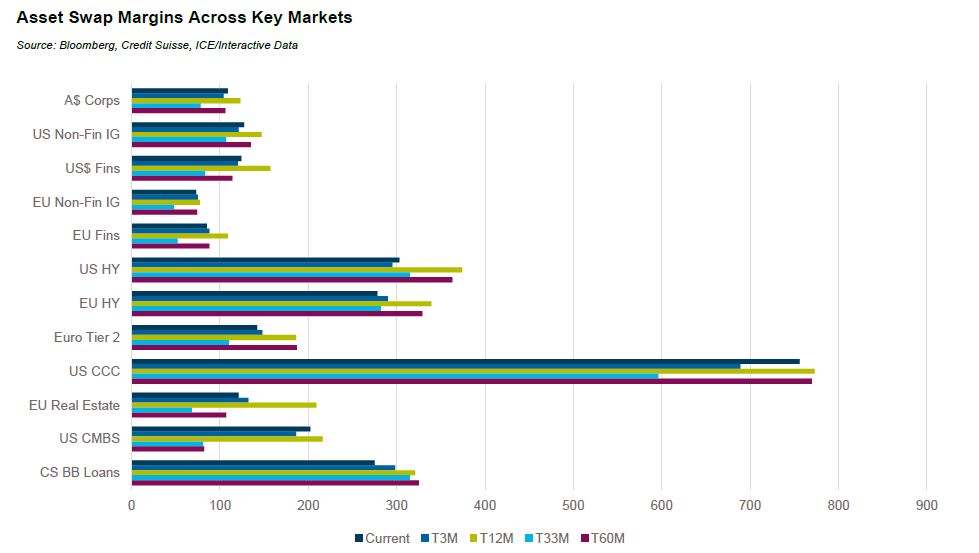
Over the quarter credit markets widened having found a resistance level against which spreads struggled to tighten. This was not consistent across markets however with US leveraged loans, European high yield bonds and subordinated financials all continuing to rally. At the other end of the spectrum there was meaningful spread widening in fundamentally exposed sectors; US CCC-rated credit and US CMBS both sold off.
While our focus is credit spread performance, a meaningful share of credit investors are focused on outright levels of yields. Moves higher in interest rates led to yields generically increasing across most markets which likely helped limit spread moves wider.
Spread performance has been helped by easier financial conditions. S&P’s Credit Cycle Indicator (CCI) continued to ease in the second quarter with corporates generally seen as stronger than households. S&P did note that the earnings recovery in the United States was uneven across sectors and cash interest payments continued to rise, weighing on liquidity. Deutsche Bank highlighted a similar theme, pointing out that while earnings are generally growing across IG markets, cyclical fundamentals are much stronger than non-cyclicals. In the US cyclicals have reduced leverage from around 1.8x in 2021 to 1.3x in Q1 2024. In contrast leverage for non-cyclicals is virtually unchanged at over 2.5x. Within speculative grade credit, loan downgrades have continued to outpace upgrades with Healthcare, Business Services and Media seeing the most ratings pressure.
The cyclical versus non-cyclical theme is also front of mind in the United Kingdom where regulated water utilities are facing significant financial pressure due to inflation, lack of capex in prior years and regulatory risks. Thames Water is the posterchild, at risk of having GBP10 billion in debt falling to a below investment grade rating. Barclays estimates that this would be the largest ever non-financial issuer to move to high yield in the sterling bond market and if downgraded it would be 11-14% of the sterling high yield market and 0.8-1% of the European high yield index.
Bank non-performing loan ratios reflected trends in public bond markets with some weakness but no signs of broad-based stress. Wells Fargo reported an NPL ratio of 0.91% in Q2, up from 0.87% in Q1 and the highest level since Q4 2020 or Q2 2017 if COVID is excluded. Within private markets, there are also mixed signals. Citigroup highlighted that median CCC exposure in private credit CLOs is elevated at 13.1% as at the end of May 2024. S&P reported that middle market loan downgrades outpaced upgrades by a ratio of 4:1 in Q1 2024 with speculative grade defaults expected to decline slightly from around 5% currently. According to the LSTA average non-accruals for US Business Development Companies increased to 3.83% in Q1 2024 from 3.65% at the end of Q3 2024.
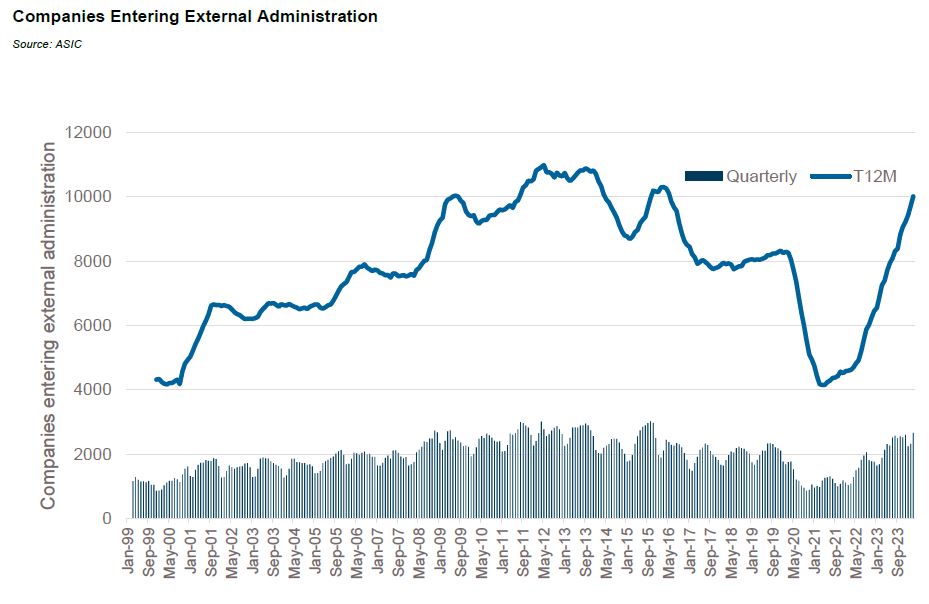
Domestically companies entering external administration has continued to rise in 2024 hitting 10,778 in the 12 months ended May 2024, a trailing 12-month rate of around 0.4%. This figure is around 200 less than the peak 12 months figure which dates back to May 2012, a trailing rate of around 0.5%. The peak rate 12-month rate was 0.53%, dating back to June 2013.
Financial Credit:
Summary views: senior unsecured financials have lagged with offshore underperforming domestic markets. Subordinated capital has outperformed relative to senior and looks expensive.
Financials issuance continued at a pace in Australia as the Term Funding Facility was fully repaid. The controversial facility which totalled A$188 billion or 4% of banks non-equity funding, provided cheap liquidity during a period of financial and social upheaval. The intent was to ensure banks continued lending and didn’t increase the cost of credit, but it did have the unintended consequence of increasing bank profitability.
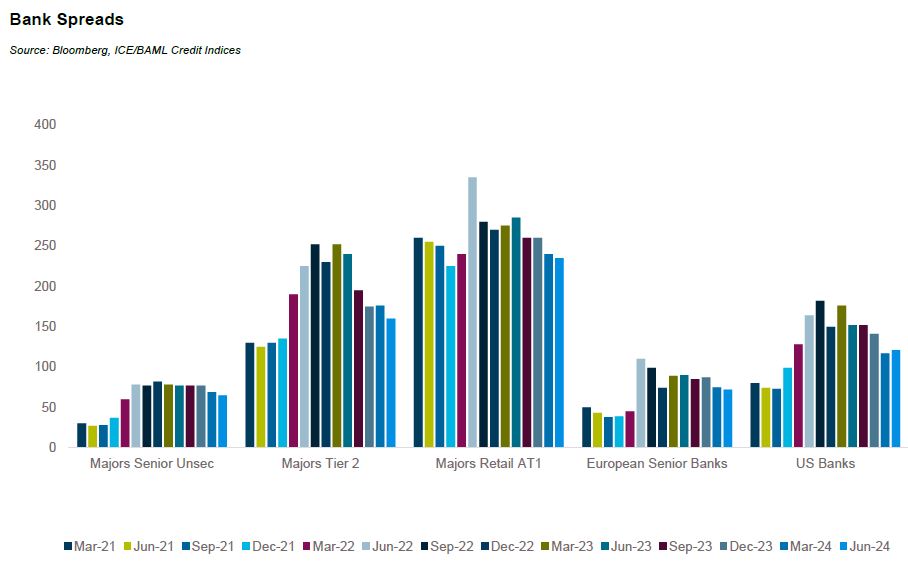
The elevated levels of issuance have helped keep funding spreads relatively wide. As at June quarter end, major bank senior unsecured spreads remained wide of their mid-2019 levels while Tier 2 bonds were 50 basis points tighter and Additional Tier 1 bonds were 115 basis points tighter. Offshore funding spreads were even wider with US banks 13 basis points wider over the same period and European banks 17 basis points wider.
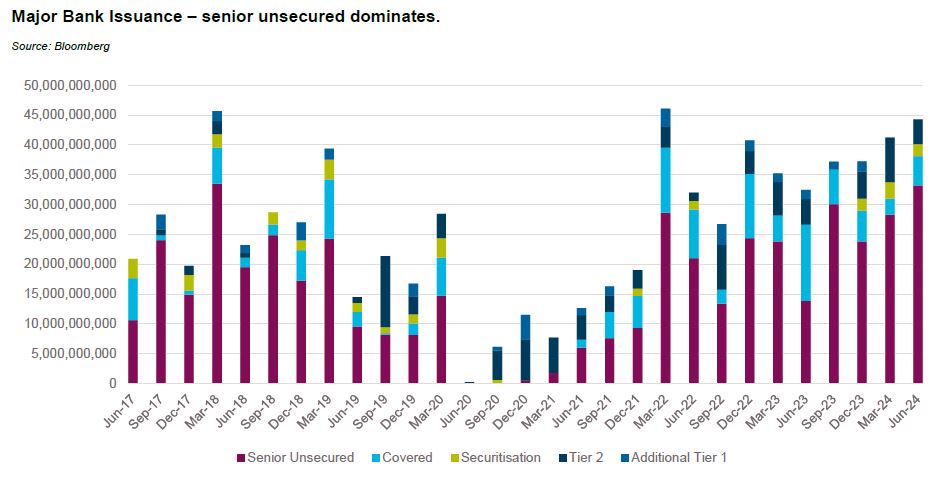
Issuance levels domestically have been unprecedented with over A$85 billion in issuance in the first half of 2024, the busiest six month period since 2009 when the government guaranteed issuance during the Global Financial Crisis. Issuance has been dominated by funding trades with Tier 2 and Additional Tier 1 debt responsible for only A$11.6 billion in issuance over the quarter, well down on the peak of A$17 billion issued in the six months ending in March 2021.
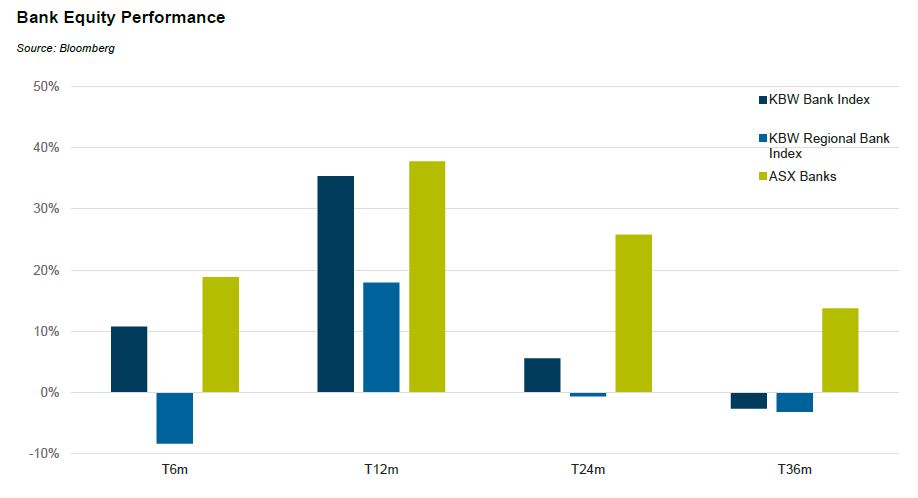
Fundamental risk concerns in the northern hemisphere seem to have driven the spread moves in those markets. In the United States, the KBW Bank Index returned 11% in the first half while the KBW Regional Bank Index returned -8.40% over the same period. Both trailed the ASX300 Banks Index over a 6 month and longer time horizon.
Banks and regional banks in the United States are trading at around 1.3 and 1 times book value, respectively versus around 1.8 times in Australia despite. Second quarter results in the United States were reasonably solid with noninterest income up for the quarter offsetting declines in net interest income. Fundamental credit performance has normalised at a level of net charge-offs which is below historical levels. Royal Bank of Canada reported that across Citigroup, JPMorgan and Wells Fargo net charge-offs were up 4 basis points over the quarter and 30 basis points over the year ending at 0.86%. With uncertainty around the Basel III endgame capital requirements, CET1 ratios are strong ranging from 11% (Wells Fargo) to 15.3% (JPMorgan). This contrasts with CBA whose bad debt charge is forecast to peak at 0.15% by Barrenjoey with a CET1 ratio of 12.2%. CBA is trading at c. 3 times book value implying an earnings yield of less than 4.5%. This for a bank which saw flat revenues and declining earnings over the last 12 months. Maybe the debt isn’t so expensive after all!
ABS & Whole Loans:
Summary views: spreads continue to rally with CLO mezzanine tranches a standout from a relative value standpoint. Private markets offering sporadic value especially emerging collateral types where credit enhancement has not been diluted.
Domestic securitisation markets did not slowdown in Q2 with over A$40 billion issued over 2024 year to date. The A$44.5 billion in issuance was only A$4 billion behind 2007 making 2024 the second busiest start to the year of all time (and we all know what happened in the second half of 2007).
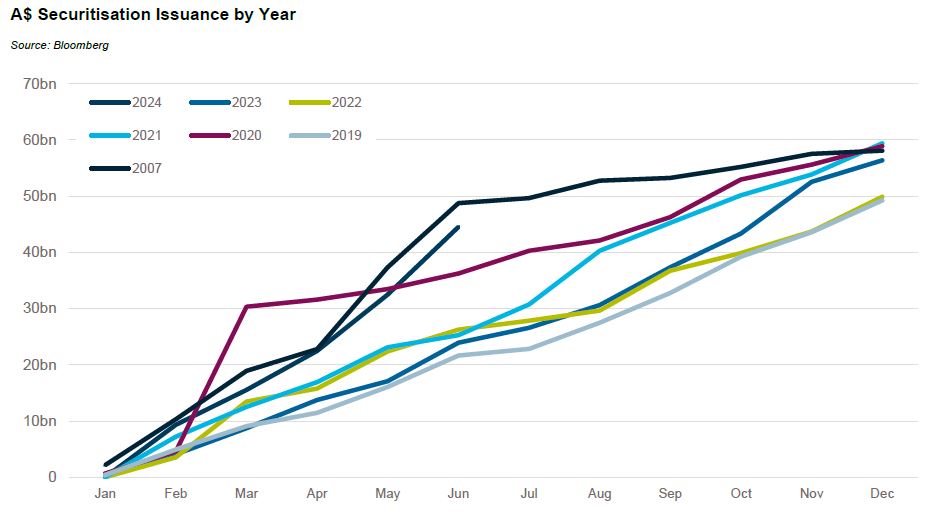
The difference between issuance in 2024 and 2007 is the share of issuance between banks and non-banks. YTD around two-thirds of issuance has come from non-banks. In 2007 this was more like 25%.
The strong levels of issuance were driven by tightening credit spreads, particularly in mezzanine tranches. Since the wides of early 2023, single A-rated non-conforming RMBS has tightened by 200 basis points with the basis to major bank Tier 2 compressing to 20 basis points from 130 basis points. This strong spread performance came despite record levels of mezzanine issuance. A$2.6 billion in non-AAA rated bonds were issued in the quarter, A$0.4 billion of which was rated below investment grade. This takes current amounts outstanding to A$19 billion and A$3 billion, respectively.
The Australian market is approaching the UK market, the largest securitisation market outside of the United States. In the UK, mezzanine issuance over the quarter was A$6 billion in non-AAA rated bonds, A$0.7 billion of which was rated below investment grade. There is circa A$58 billion in non-AAA issuance outstanding and A$6.7 billion rated below investment grade.
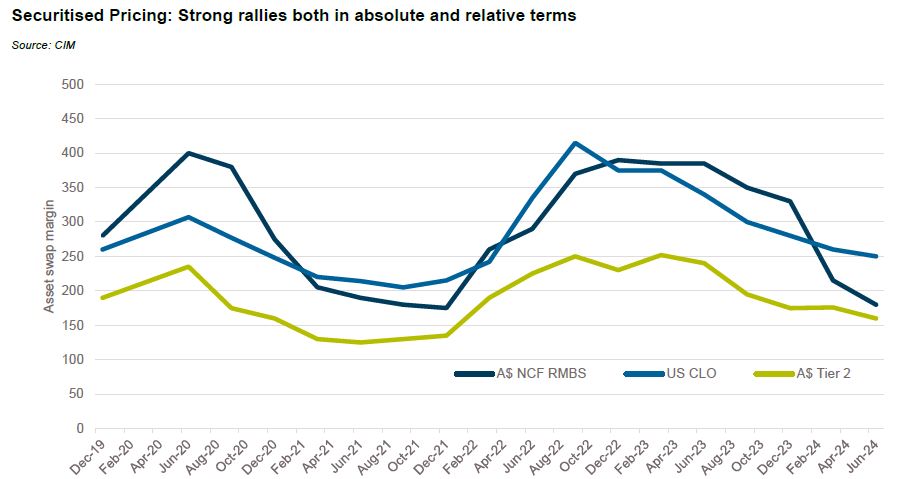
The standout relative value in securitised markets continues to be collateralised loan obligations (CLOs) which are now trading around 75 basis points wide to similarly rated non-conforming RMBS having historically traded flat to inside.
Fundamental performance remains sound. The Fitch Dinkum ABS indices show 30+ delinquencies holding steady at around 1.2% well below the COVID peak of over 3%. Annualised net losses are ticking higher but at around 0.5% they are closer to recent peaks of 0.6% reached in mid-2019. The story is similar in Europe where Auto ABS 30+ delinquencies rose to 1% up from 0.81% 12 months ago, having peaked at 1.5% during COVID. Annualised losses are 0.41% up from 0.32% 12 months ago having bottomed out at below 0.2% during 2022.
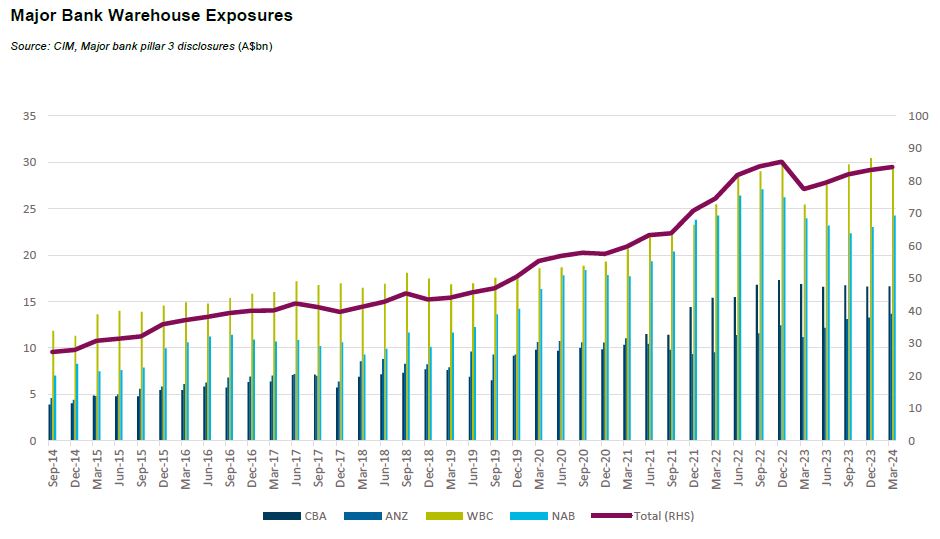
Despite a strong start to public issuance, private warehouses grew over the first quarter of 2024. Major bank warehouse exposures have almost fully returned to peak levels of mid-2022. With strong public issuance in Q2, we suspect warehouses may have declined slightly from Q1 levels but will remain elevated regardless given the longer term trend of banks reducing exposure to non-mortgage consumer loans.
Real Estate Loans:
Summary views: Fundamentals continue to be weak with offshore indicators suggesting that further stress is to come. Both bank and non-bank lending markets have proved mostly resilient albeit with increasing signs of stress that may lead to a broader based repricing of risk premiums and an opportunity for alternative lenders who are not overexposed to the sector
Domestic bank exposure to commercial real estate grew 1% in the March quarter, broadly in line with the year on year growth of 12%. On a year on year basis growth was strongest in Land development, Other, Industrial and Other residential with the weakest growth in Tourism, Office and Retail.
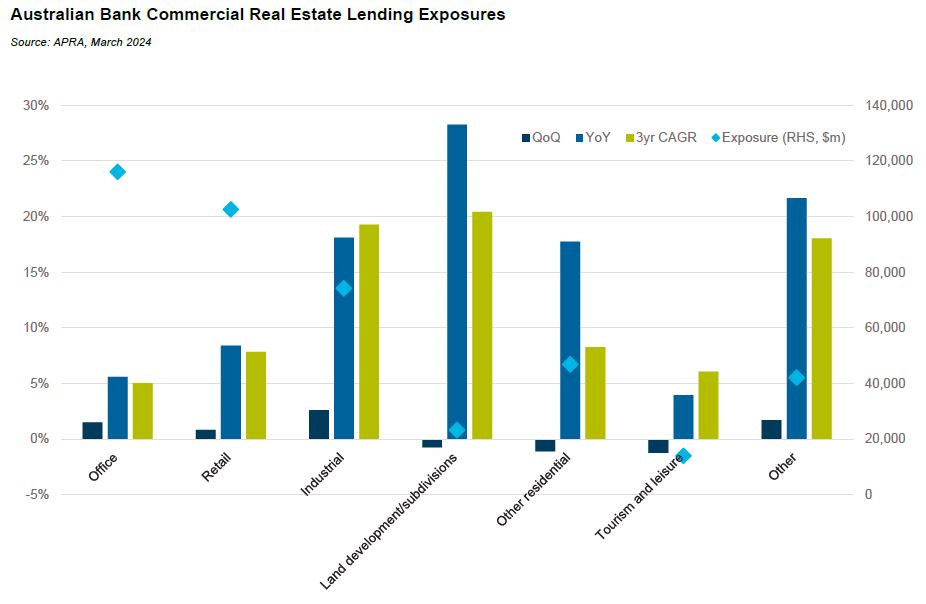
Major bank share of CRE lending has continued to steadily decline sitting with a 71% share of limits extended in Australia. The lowest share is to the tourism and leisure sector which currently sits at below 40% but the sharpest declines in market share over the past couple of years have occurred in Office, Industrial and Land development. Some of these moves are counterintuitive; the conventional wisdom is that banks have almost completely withdrawn from development and construction lending. APRA data shows that while limits extended to Other Residential lending from banks are flat since mid-2018, the actual exposure is up by 25%. Over the same period limits to Land developments/subdivisions has increased by around 13% while actual exposure has increased by over 50%. We think this is due in part to the well-publicised issues facing construction projects centred around delays to completion and capitalisation of interest.
Asset quality continues to deteriorate. Non-performing loans at the banks have increased to 0.8% up from 0.5% in mid-2022 with major banks at 0.9%. In the United States non-performing loans at the largest US banks are approaching 1.5% while at smaller banks the figure is more like 0.8%. There are also anecdotal signs of stress within non-bank markets in Australia. A larger non-bank lender disclosed that in the March quarter they had 0.48% of their portfolio in default with another 4 loans out of c. 200 repaid during the quarter post a default event. The ongoing restructuring at Public Hospitality Group is still playing out with multiple non-bank lenders impacted and at risk of loss.
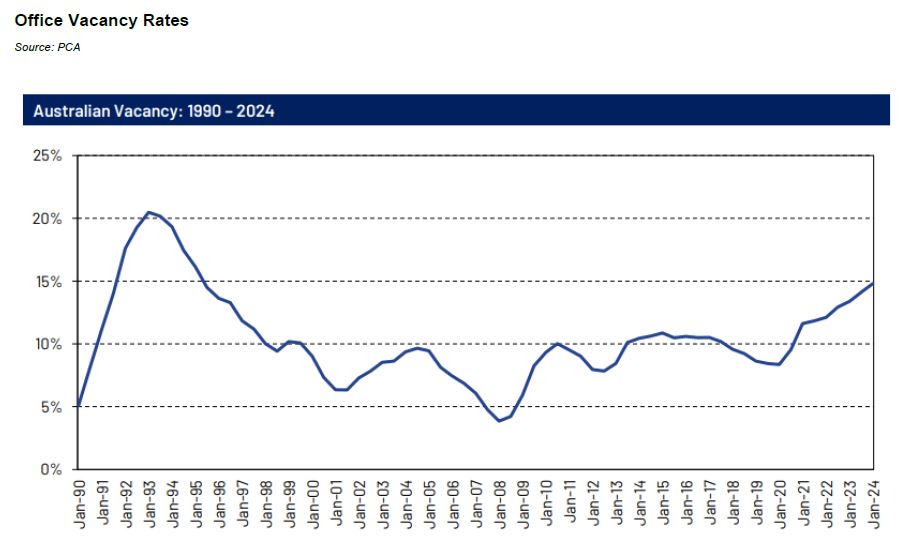
The fundamental backdrop for the office sector remains weak. Vacancies in Australia will almost certainly exceed 15% even as there are signs of stabilisation with JLL reporting that five out of six CBD markets recorded positive net absorption over the quarter. Prime gross effective rents were up by 0.4% over the first quarter but fringe and secondary markets are still seeing flat rental growth and in some cases declines. Melbourne is the weakest CBD market with rents still declining for both prime and secondary asset and vacancy rates of 18%, well above the national average.
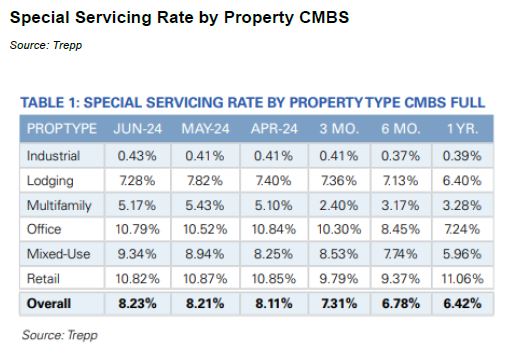
Offshore stress continues to build. A report released by Moody’s in June predicted that nearly a quarter of all US office space will be vacant by 2026, reducing revenue for landlord by between US$8 to US$10 billion and potentially translating into reductions of office values in the order of a quarter of a trillion dollars. CMBS special servicing rates on continued to increase in June driven by Office which is currently at 10.79% though there are signs of broader stress emerging with 5 out of 6 property types experiencing an increase over the quarter. Over US$45 billion in CMBS loans are in special servicing.
JPMorgan also reported that more than 10% of CMBS debt has been restructured which is more than the level of restructurings that took place during the Global Financial Crisis. The restructurings include forbearance of interest and extensions of maturity; a majority of loans originally scheduled to mature in 2023 and 2024 remain outstanding.
While fundamentals in Australia are far better than in the United States, risk aversion is creeping into the Australian market. NAB noted in their half year results that the 90+ days past due and GIA loans had increased to 0.55% in the March quarter, a 0.18% increase over the half year, a level last seen in late 2015. In response a material portfolio of new and renewed CRE investment lending has been associated with loan to value ratios below 60%. This is an opportunity for alternative lenders to step in where banks are stepping out provided, they are not already too overexposed to the sector and already facing credit issues. CIM’s pipeline in private CRE opportunities reflects this flow with a significant uptick in deal inquiry levels.