Market Review & Outlook:
Non-Financial Credit:
Summary views: high yield looks expensive relative to investment grade. Favouring private markets over public given illiquidity premiums have not tightened as much as credit spreads.
Over the quarter credit markets widened moderately with mid risk credits outperforming, extending the trend we observed last quarter. BB-rated leveraged loans are the only part of the global corporate credit market we track which is trading inside of the tight levels of the post COVID environment with high yield indices not far behind. At either ends of the spectrum, high grade and stressed credits are still trading at spreads which are wide of the tight levels of late 2021.
Interest rates declined over the quarter which may have put pressure on credit spreads of fixed rate assets. Notably this reversed in late September and continued into early October which may see spreads on fixed rate assets outperform.
Strong spread performance has fuelled issuance. High grade and leveraged loan gross issuance in September was at record levels with high yield supply at a 3 year high. The rally in interest rates also fuelled longer duration issuance with 2024 average duration of high grade issuance at 10.5 years, up from 9.6 years in 2023 (though remaining well below the peak of 12.5 years in 2020).
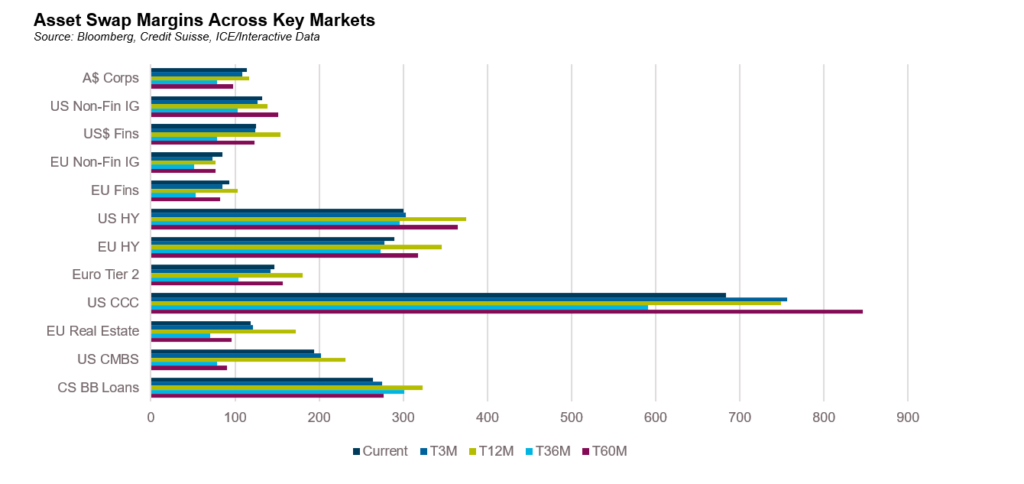
The relatively strong performance in the belly of the credit curve can be explained by benign financial conditions. S&P reported that their negative outlook bias fell over the quarter with the speculative grade default rate starting to stabilize at just under 5% on an annualized pace. Net ratings actions have been slightly positive over the quarter (i.e., more upgrades than downgrades), albeit in speculative grades, downgrades are outpacing upgrades at a 2:1 ratio. However, it is the weakest credits that should continue to attract the most attention and this population remains elevated with B- & below rated credit representing more than 25% of the speculative grade markets. Despite this declining from just under 35% at the onset of COVID, this share is still above the GFC peak of just under 25%, implying that while conditions are improving, credit markets remain vulnerable to negative shocks. This is especially true when one factors in the growth of private credit markets which did not exist in size during the GFC. A large share of this market would fall into the B- & lower rated categories.
In terms of sectors and regions most exposed, European markets are lagging the strong recovery in the United States. Sectors such as automakers appear to be under the most pressure, exposed to rising protectionism, geopolitical risks and a weakening outlook for the household sector.
Within private markets, scrutiny of performance is only increasing. Proskauer’s third quarter Private Credit Default Index came in with a 1.95% default rate which was down from the second quarter rate of 2.71% but higher than the first quarter figure of 1.84%. As we have previously noted, private credit default rates have come under scrutiny with Moody’s noting that even as default rates have stabilized, the proportion of interest income within private credit funds that is capitalized rather than paid (so called Payment in Kind or PIK income) has increased to 7.4% in the September quarter, up from 5.4% a year ago. While use of PIK is not necessarily a sign of stress, the increased share implies that servicing interest payments is more challenging in the current interest environment.
Within Australian private credit markets, use of PIK is generally limited to specific sectors such as construction finance where the underlying assets do not generate regular cashflows until the project is completed, thus necessitating capitalization of interest during the project. Asset quality within private markets in Australia continues to be relatively strong with only a small number of transactions underperforming.
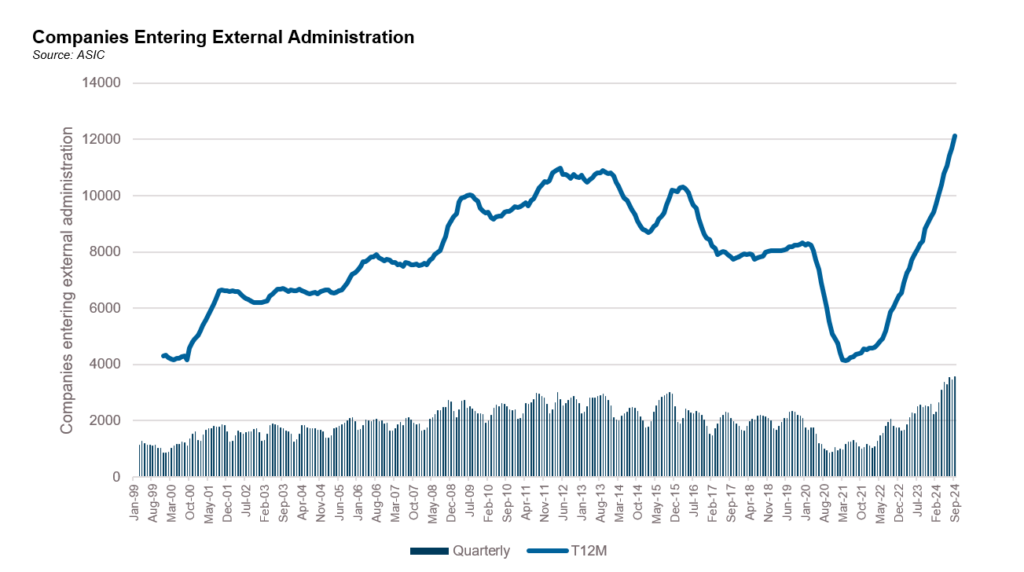
Domestically companies entering external administration has continued to rise in 2024. Over 12,000 companies entered insolvency in the 12 months to September, the highest figure on record. Still, if we projected forward from 2019 in a straight line there are still 3,000 less companies that have gone through insolvency due to the benign trends through 2020-2022. At current rates, we will have returned to trend by the end of the first quarter of 2025.
The RBA produced reporting over the quarter suggesting that the domestic private credit market had reached around A$40 billion in size and had grown through the post COVID environment at a 20% plus compounded annual rate albeit it had reduced to just 10% in 2024. The data excludes non-syndicated loans which are especially prevalent in real estate lending markets. E&Y estimates put the market size at more like $188 billion based on a survey of private debt funds and non-bank lenders. We suspect this figure more closely reflects the size of the private lending opportunity across all sectors (i.e., not just corporate direct lending).
Financial Credit:
Summary views: senior unsecured financials have lagged. Insurance company sub debt looks cheap to banks, especially given APRA news around AT1.
The most important news for financials this quarter was APRA’s announcement on the 10th of September that they would phase out the use of Additional Tier 1 (AT1) capital instruments by banks. The proposal would see large, internationally active banks increasing their CET1 ratios by 0.25% and replacing the remainder with Tier 2 instruments while smaller banks could fully replace AT1 with Tier 2. The transition period would begin in 2027 and end in 2032.
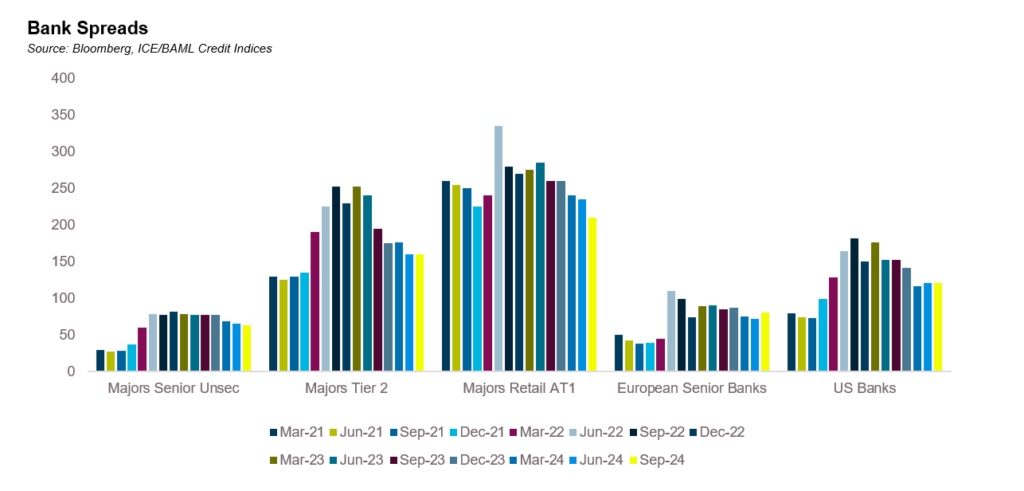
While the response from market participants was swift and significant with many denouncing the change as out of step with global standards and suggesting the change would make banks even riskier, the reaction from markets was benign. AT1 pricing rallied sharply as market participants effectively formed a view that these instruments were now on par with Tier 2 in terms of the risk of non-viability and non-call. Tier 2 widened, especially in US dollars, before rallying and ending the quarter broadly flat. Senior unsecured was flat over the quarter with most participants viewing APRA’s proposal as having no impact either way on the senior part of the capital structure.
Insurers were not included in APRA’s proposal meaning they can continue to issue AT1 instruments. There are less than $3 billion in listed subordinated capital instruments issued by insurers. Currently BBB-rated insurance tier 2 paper is trading around 30 basis points wide of non-major bank Tier 2 on a like for like ratings basis.
European banks continue to lag US and Australian banks in terms of spread performance, a consistent theme through the post COVID environment. This being said European senior bank spreads do trade tight to US banks on asset swapped terms with both generically trading wide to Australian bank spreads. Note European and US banks average credit ratings are A3 and A2, respectively, slightly weaker than the average ratings of the Australian banks.
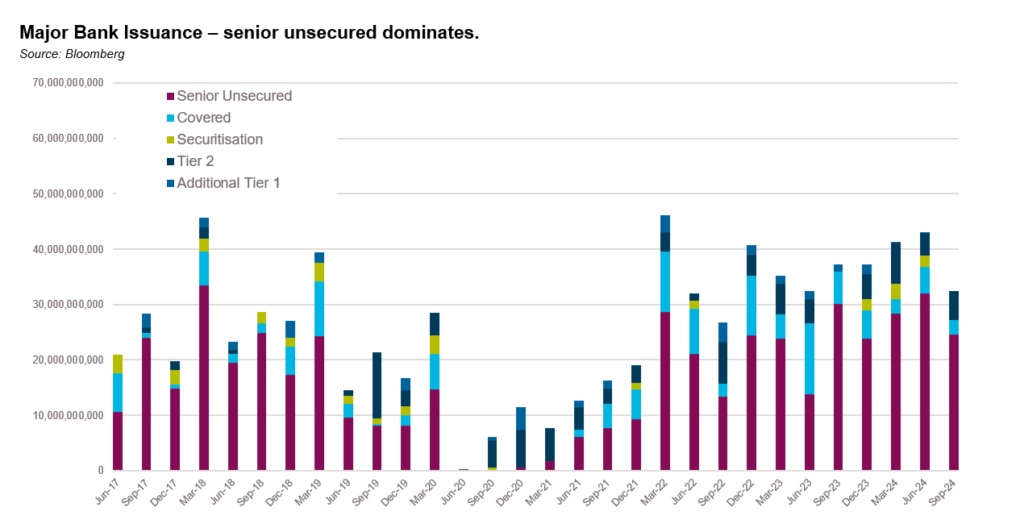
Issuance levels domestically moderated over the quarter though this was unrelated to APRA’s news. Major banks have been extremely active in prior quarters with the trailing 12-month issuance through the June quarter of $158 billion the most in a 12-month period since the GFC when over $180 billion was issued. The slowdown in issuance can be attributed in part to a shrinking funding gap driven by households who seem to still have an excess of liquidity.
While APRA’s proposal will see increased Tier 2 issuance with another $40 billion in volume required on top of the $125 billion in current Tier 2 outstandings, most market participants do not see this increase as problematic hence the lack of pricing response. This will clearly be dependent on market conditions at the time given the major bank Tier 2 outstandings will be around $40 billion per institution making them the largest issuers in global markets.
Fundamental performance from the banking system in Australia has continued to slide albeit at a slow pace. At the end of June 2024, 1.1% of loans were non-performing, 0.3% above the low from 2022. In the United States, fundamental performance has yet to stabilise but remains at non-concerning levels. Charge off rates on all loans hit 0.65% in June, the highest level since 2014. Delinquency rates on all loans ended the second quarter at 1.44%, below the peak rate of 1.64% reached in the fourth quarter of 2020 and even below 2019’s averages of 1.45-1.55%.
Despite the relatively low levels of non-performing assets, US banks appear to remain conservative in applying their lending standards. The Federal Reserve Senior Loan Officer Survey shows that banks have been tightening lending standards for 9 consecutive quarters even if the share of banks tightening is reducing.
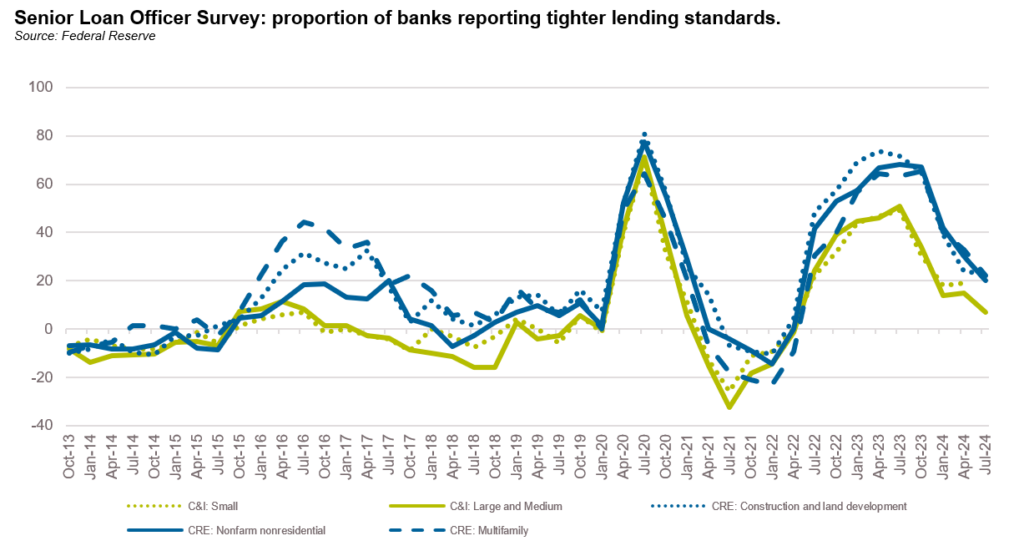
Equity valuations increased across the board in the third quarter with returns ranging from 6-15% with European banks lagging. For the US banks third quarter results were generally fine with tepid loan growth, particularly in corporate loans offset by low credit losses for the quarter and building capital levels.
ABS & Whole Loans:
Summary views: mezzanine spreads bottoming at very tight levels relative to financials and senior tranches. CLO mezzanine tranches remain a standout from a relative value standpoint. Selective on private markets, focussing on scale non-banks who require institutional sized funding solutions.
The domestic securitisation show continued into the third quarter of 2024. Year to date $57 billion has been issued and absent another global pandemic, it is a certainty that full year issuance will exceed $60 billion for the first time ever.
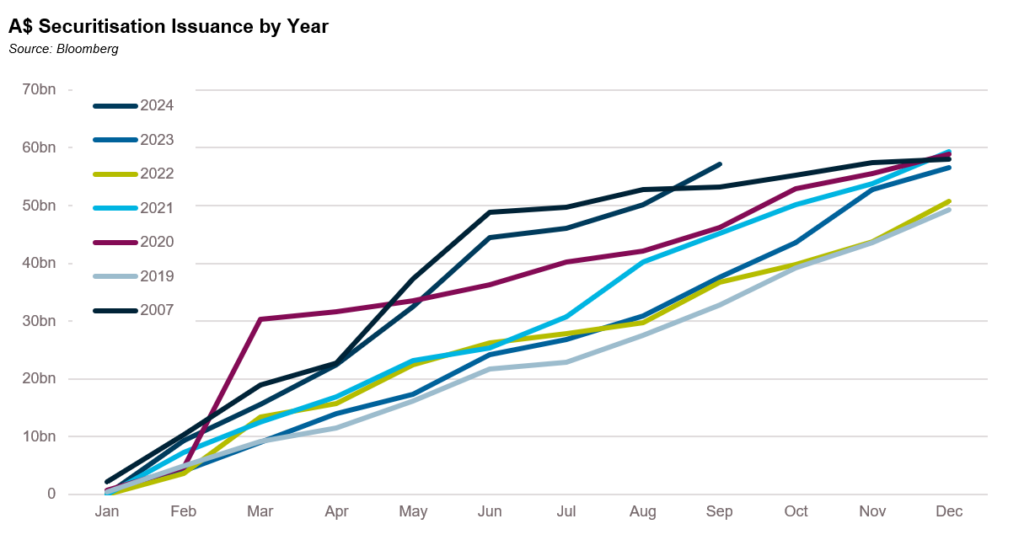
Offshore markets have not gone quite as far. In the United Kingdom, securitised issuance year to date is close to recent highs but is less than one third of peak issuance levels experienced in the lead up to the Global Financial Crisis. The difference between issuance in 2024 and 2007 is the share of issuance between banks and non-banks. YTD more than 75% of issuance has come from non-banks. In 2007 this was more like 25%.
Non-banks have different needs when it comes to issuance. They are not simply looking for financing but focussed on maximising the return they can achieve on their (limited) capital. Typically, this comes through issuing as much of a deal as possible so that the non-bank can recycle their capital into originating new loans and growing their loans under management.
As such in 2024, there has been $7.5 billion in non-AAA rated issuance, more than double 2007 levels. For the last 4 years, non-AAA issuance has exceeded $7 billion per annum, peaking in 2021 at over $8 billion. From a pricing perspective this increased supply has not weighed on credit spreads. In fact, the opposite has occurred. A-rated spreads have tightened by 150 basis points year to date although much of this occurred in the first half of the year with spreads broadly flat in the third quarter. Sub-investment grade spreads have tightened by 230 basis points year to date with the moves tighter lagging higher grade tranches.
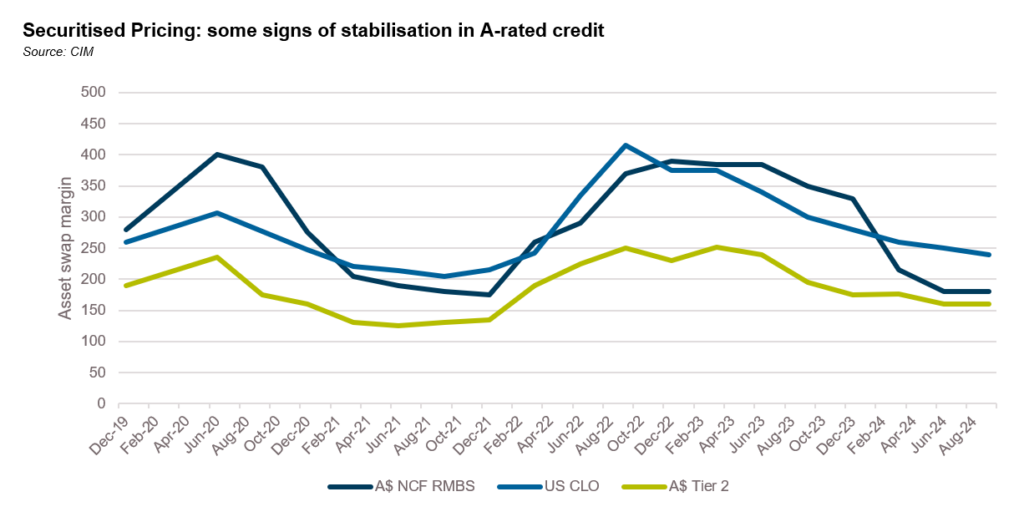
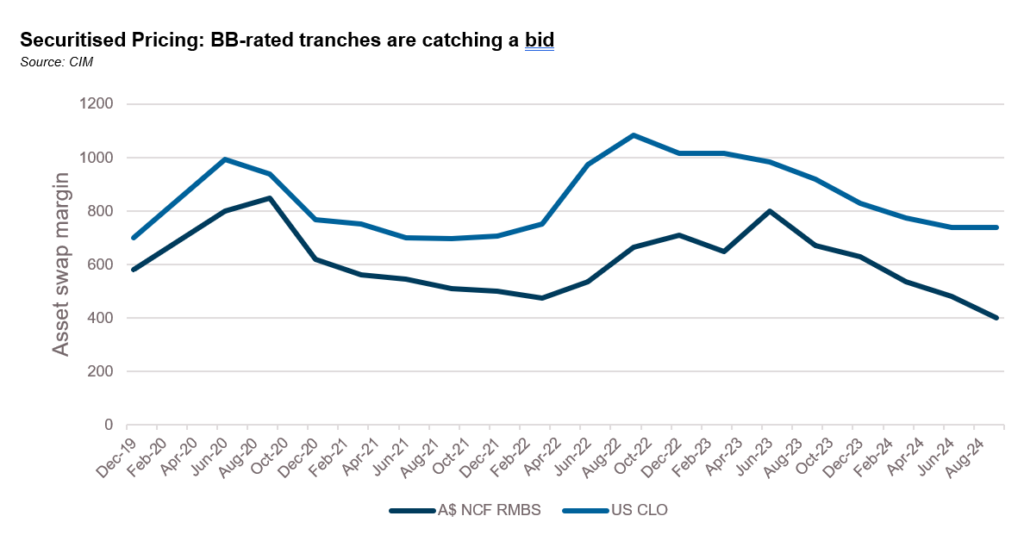
Offshore the story is similar with mezzanine spreads at similarly tight levels and the basis between AAA and non-AAA paper being anchored around recent tight levels. As previously highlighted collateralised loan obligations remain cheap having lagged the strong rally in other similarly rated securitised products.
Contrast these moves with AAA markets where spreads have only tightened by 25 basis points in the past 12 months. In fact, the basis between 3-year AAA and single A rated non-conforming RMBS is around 50 basis points, 20 basis points inside the tight levels of 2021 and around 100 basis points tighter than pre-COVID average levels.
The wideness of AAA spreads means despite the tightness of mezzanine spreads that the economic returns for non-bank lenders have not improved. The listed non-bank sector generally trades at a discount to book value with valuations of non-bank lenders in the unlisted space being even more uncertain.
Despite the weak equity story, underlying collateral performance has only moderately weakened from benign levels. The Fitch Dinkum ABS indices for the second quarter showed 30+ day arrears increasing to 1.71%, a 3 year high and just below pre-COVID levels of 1.8-2.4%. Annualised losses have also increased to 0.59%, flat for the quarter but in line with pre-COVID levels.
Residential mortgage markets paint a similar picture of higher but not concerning levels of arrears. The S&P Spin Non-Conforming Index was over 4% at August month end. Excluding January, which is often elevated due to seasonal effects, this is the highest level in 3 years but is around 25 basis points lower than the average level for 2019.
Offshore collateral performance is mixed. In the United States, prime auto loans 60+ delinquencies around 0.5%, the highest levels in the last 8 years (though not materially so) while subprime 60+ delinquencies have stabilised at around 5% though 90+ delinquencies continue to inch higher. Consumer loan 60+ delinquencies are around pre-COVID levels at 4% and are showing signs of stabilisation.
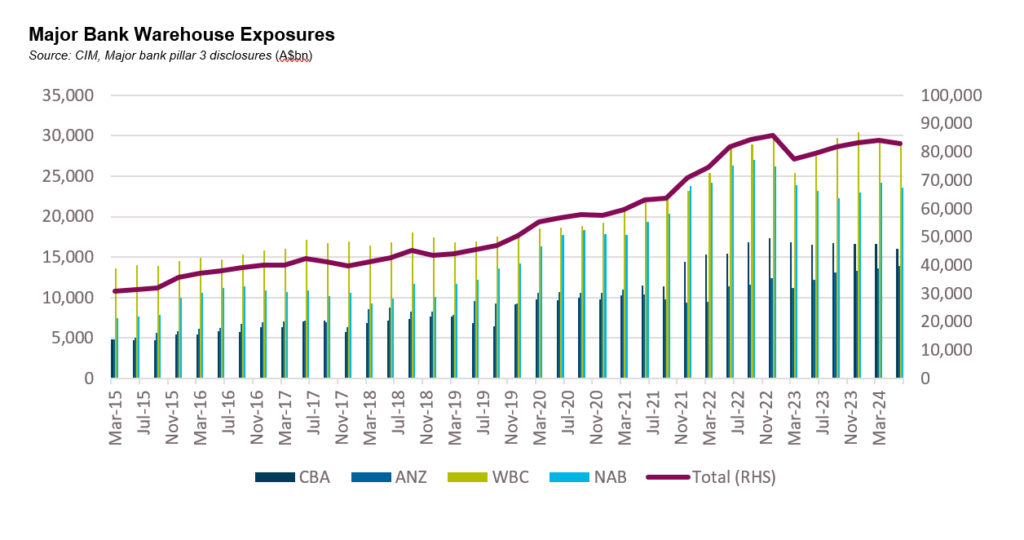
In private markets, asset-based finance has become somewhat of a buzz word. With no notable SRT (Significant Risk Transfer) or CLO markets to speak of, the domestic asset-based finance markets centres around warehouse transactions which have also been attracting considerable attention. As at June, private major bank warehouses exposures were $83 billion, down from a peak of $86 billion in December 2022. With fierce competition amongst lenders in traditional mortgage markets, non-bank lenders are increasingly searching for alternative products to drive volumes and capital solutions to drive efficiency.
Real Estate Loans:
Summary views: Fundamentals continue to be weak tracking offshore markets. Private pipeline is growing to reflect more opportunities for non-bank lenders and is expected to be increasingly attractive provided lenders are not already overexposed to the sector.
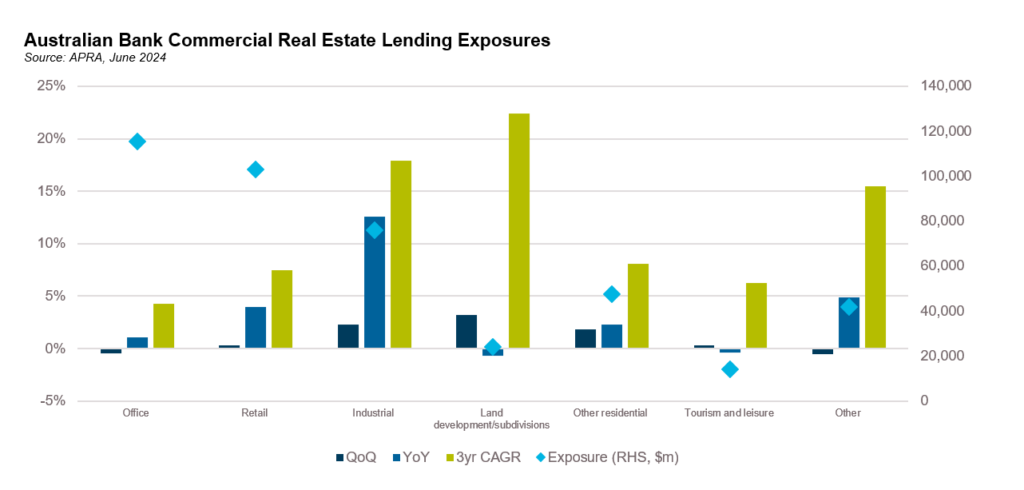
Domestic bank exposure to commercial real estate grew 1% in the June quarter, albeit with fairly volatile trends at an underlying sector level. Office exposure, the largest exposure for the banks at $116 billion, was down over the quarter and is only up 1% for the year, the slowest pace of growth since December 2012. Retail was flat for the quarter but still grew at 4% on a trailing one-year basis. Year on year growth across all sectors is below the 3-year compound annual growth rate, reflective of a more conservative lending environment.
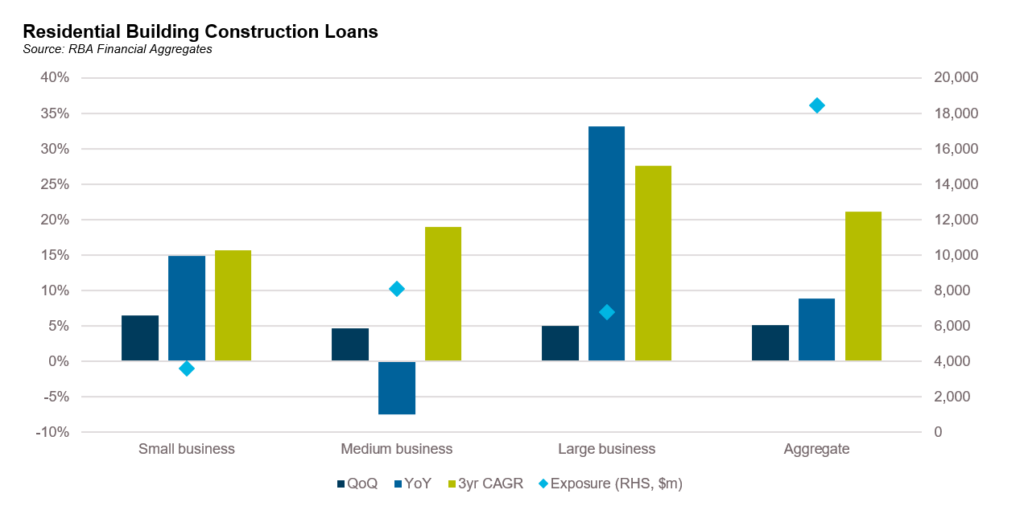
Bank lending to land developments/subdivisions is up over 20% on a 3-year compound annual growth rate. This tracks closely to the RBA’s financial aggregates data which shows residential building construction loans up 21% over a 3-year compound annual growth rate through August 2024. The strongest growth has come from large businesses defined as those with turnover exceeding $50 million. Notably only large businesses had a higher trailing 1 year growth rate (of 33%) compared to the 3-year annualised rate (which was 28% p.a.).
Asset quality on bank balance sheets showed some signs of stabilisation in the June quarter, declining by 0.1% to 0.7%. In the United States delinquent loans at the largest US banks are approaching 1.8% while at smaller banks the figure is more like 0.9%. This is the highest figure since the first quarter of 2014 when delinquency rates were still declining following the GFC. For context, impaired loans at Australian banks peaked at 5.7% in 2010.
Within the non-bank sector in Australia, there are signs of weakness, both at an anecdotal and aggregate level. A larger non-bank lender disclosed that in the June quarter they had 4 loans out of c. 250 loans in default with 2 of the 4 entering defaults during the quarter. Delinquencies in several mortgage funds we track are also steadily increasing but with most funds attracting inflows of capital, problem assets can be managed.
The fundamental backdrop for the office sector is showing some signs of stabilisation albeit not equally distributed. JLL reported that office vacancies in Australia improved to 15.1% even as vacancies increased to 19.8% in Melbourne. Underlying this data is even more divergent across geographies with vacancies ranging from mid to high single digits on the Gold Coast, East Melbourne and Canberra up to mid to high 20s in Crows Nest/St Leonards and St Kilda Road. Concerning for the Melbourne market is that 4.7% of current stock will enter the market over the coming two years with only 20% pre-committed. Further, extending a trend that has been observed globally, demand is almost exclusively concentrated in A-grade and premium assets.
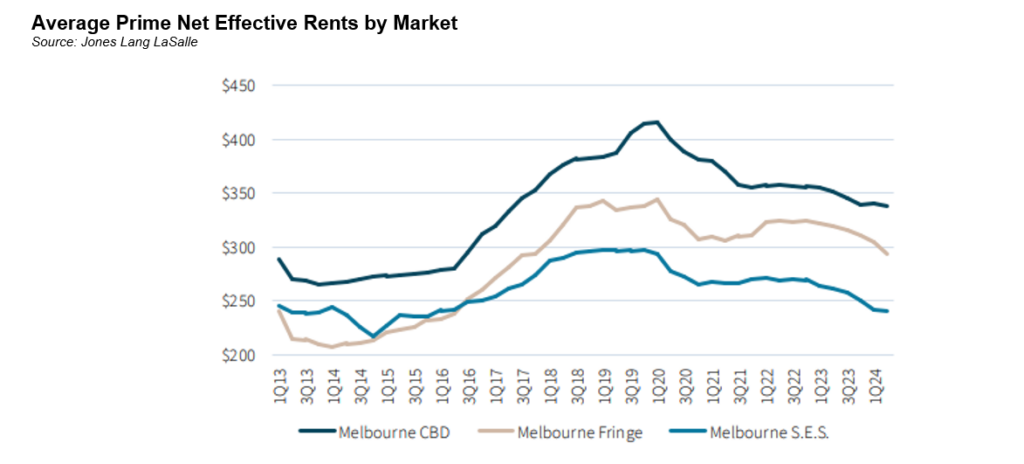
The issue for lenders with these divergent trends is that buildings with elevated vacancy rates will struggle to attract tenants and drive rental growth. According to Macquarie analysts (via the AFR) Melbourne effective rents have fallen by 6.4% year on year. Net effective rents in Melbourne southeastern suburbs have not increased in a decade. Several high-profile transactions have taken place in recent months at material discounts to peak valuations; 367 Collins St traded at a 27% discount to the December 22 book value and 628 Bourke St traded at a 36% discount to the 2017 valuation. Given these moves in valuations and rents, it is not hard to see lenders taking losses on Melbourne office, particularly non-CBD assets.
Reflecting the challenged conditions in office, the pipeline of private markets opportunities has grown considerably with a bias towards Victorian transactions.
Offshore stress continues to build. CMBS special servicing rates on continued to increase in June driven by Office which is currently at 12.58% though there are signs of broader stress emerging with all property types experiencing an increase over the quarter. In October, the New York Fed published a research piece called Extend-and-Pretend in the U.S. CRE Market. In the piece they estimated that loan modifications contributed to a circa 5% contraction in lending volumes. Because of loan modification activity loans maturing in the next 3 years increased from 11% to 27% of total bank capital increasing financial stability risks. They also highlighted how the proportion of non-performing loans at weaker capitalised banks is lower than at more strongly capitalised banks, hypothesising that weaker capitalised banks have been more likely to “extend and pretend”.

Blackstone reported a similarly weakening trend for its US$20 billion mortgage REIT (BXMT) with non-performing loans increasing from 10% to 12%. BXMT is down over 20% over the last few years and is currently offering a dividend yield of over 10%, pricing at an 18% discount to book. Its bonds are Ba3/B+ rated on negative outlook and is trading at an asset swapped margin of around 300 basis points.
On behalf of the team, thanks for reading.
Pete Robinson
Head of Investment Strategy – Fixed Income | +61 2 9994 7080 | probinson@challenger.com.au
For further information, please contact:
Linda Mead | Senior Institutional Business Development Manager | T +61 2 9994 7867 | M +61 417 675 289 | lmead@challenger.com.au | www.challengerim.com.au
Disclaimer: The information contained in this publication has been prepared solely for solely for the addressee. The information has been prepared on the basis that the Client is a wholesale client within the meaning of the Corporations Act 2001 (Cth), is general in nature and is not intended to constitute advice or a securities recommendation. It should be regarded as general information only rather than advice. Because of that, the Client should, before acting on any such information, consider its appropriateness, having regard to the Client’s objectives, financial situation and needs. Any information provided or conclusions made in this report, whether express or implied, do not take into account the investment objectives, financial situation and particular needs of the Client. Past performance is not a guide to future performance. Neither Fidante Partners Limited ABN 94 002 895 592 AFSL 234 668 (Fidante Partners) nor any other person guarantees the repayment of capital or any particular rate of return of the Client portfolio. Except to the extent prohibited by statute, Fidante Partners or any director, officer, employee or agent of Fidante Partners, do not accept any liability (whether in negligence or otherwise) for any errors or omissions contained in this report.
