
What We’re Watching: Quarterly Report – December 2024
January 2025
Market Review & Outlook:
Non-Financial Credit:
Summary views: high yield has outperformed investment grade and the United States has outperformed Europe and Australia but appears priced for perfection. Favouring private markets over public given illiquidity premiums have not tightened as much as credit spreads.
Over the final quarter of 2024 credit markets tightened across the board with all key markets rallying. The most expensive part of the credit market appears to be US speculative grade credits which are trading at close to post GFC tight spread levels. Investment grade credits are trading at multiples of 1.3 to 2.6 times post GFC tight levels. For context, US high yield is still trading at a spread level which is 1.6 times the early 2007 tight levels while investment grade credit is upwards of 2.5 times the 2007 tight levels. European credit markets have continued to lag US markets, though some of this can be attributed to a collapse in the cross currency basis which has moved from 30 basis points to zero over the past 18 months. European high yield bonds are trading at 1.5 times the post GFC tight levels and so appear relatively cheap on a historical comparison. Unsurprisingly given the fundamental credit concerns, the biggest laggards across key markets are real estate affected sectors. European real estate borrowers tightened over the quarter but remain at 2.4 times the post GFC tight levels.
Asset Swap Margins Across Key Markets
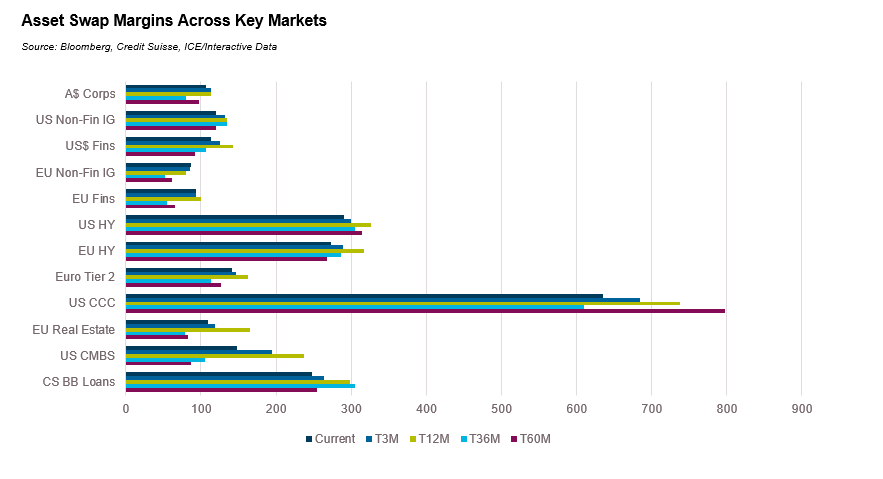
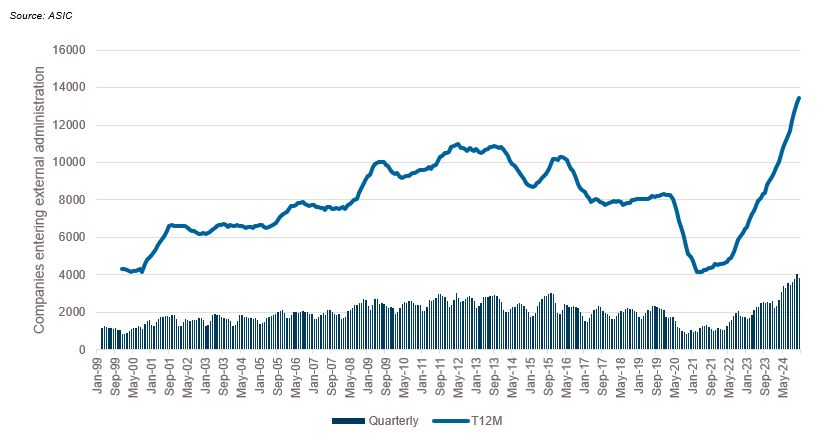
Credit spreads in US private markets declined in Q3 with all in yields around 2% lower over the year. Illiquidity premiums tightened to approximately 1.25% having been around 2% towards the end of 2023. The strong spread performance in 2024 can be best explained by the impressive reliance shown by both public and private credit markets to higher interest rates. This came despite inflation remaining stickier than markets had predicted throughout the year. In the fourth quarter the US broad market index declined by 3% as yields increased by 100 basis points. The reality is that over 2024 corporate balance sheets have mostly been resilient to the impacts of higher inflation. Golub Capital’s Middle Market Report noted that in Q4 private companies achieved year on year growth of 5.9% in revenues and 9.3% growth in earnings with all key sectors (Consumer, Healthcare, Industrials and Technology) having positive growth. US public investment grade markets saw only modest deterioration (through Q3, Q4 numbers not yet available) with both net leverage and interest coverage weakening. In both high yield and leveraged loan markets there was topline and earnings growth over the third quarter leading to improved leverage metrics. In middle markets Fitch noted an increase in leverage, approaching 5 times. Despite sound fundamentals at an aggregative level, default rates remained elevated with US speculative grade default rates at around 6% due to higher loan defaults. Moodys forecast default rates declining to below 3% by the end of 2025 though this is difficult to envisage if interest rates stay elevated. Fitch’s privately monitored default rate, a good proxy for the private credit market, increased to 7% in Q3 up from 5% in Q2 and approaching the 2020 peak of 7.3%. Within Australia companies entering external administration has continued to increase. Over the 12 months ending December 2024 13,500 companies entered insolvency, the highest figure on record. On a quarter-on-quarter basis insolvencies are still increasing. November 2024, the last month for which we have a full month’s data was the highest level of insolvencies on record. We estimate that in 2024 over 0.5% of all companies entered administration, the highest level since 2013. We have previously called out that cumulative insolvencies since 2019 are still below trend levels due to the sharp reduction during COVID but this is quickly unwinding. At current trends, the lull in insolvencies during COVID would have been fully caught up by March 2025.
Companies Entering External Administration
Activity in domestic private lending markets has continued at a pace despite some evidence of stress in the market. Alvarez & Marshal reported that in 2024 the private lending market in Australia grew to A$120 billion (including asset finance but excluding commercial real estate lending), a moderate 7% year on year growth rate. While statistics on the aggregate level of stress in the market are heard to come by, the number of borrowers facing pressure increased in 2024. Names such as Rockpool, Bingo Industries, Healthscope, OnCall, The Star and Bis Industries having either gone through a restructure or are likely to breach debt covenants.
Financial Credit:
Summary views: senior unsecured financials have lagged the rally across the rest of the bank capital stack and looks cheap to corporates and asset backed. Tier 2 and AT1 is converging at tight levels with supply risks in Tier 2 the most pressing concern.
Financials performed strongly in the final quarter of 2024, tracking moves in broader credit markets. Domestically spread performance has been strongest in the most subordinated tranches, with major bank senior flat for the quarter while Tier 2 and Additional Tier 1 continued to tighten. Offshore, European banks have underperformed US banks for most of 2024 and the final quarter was no exception.
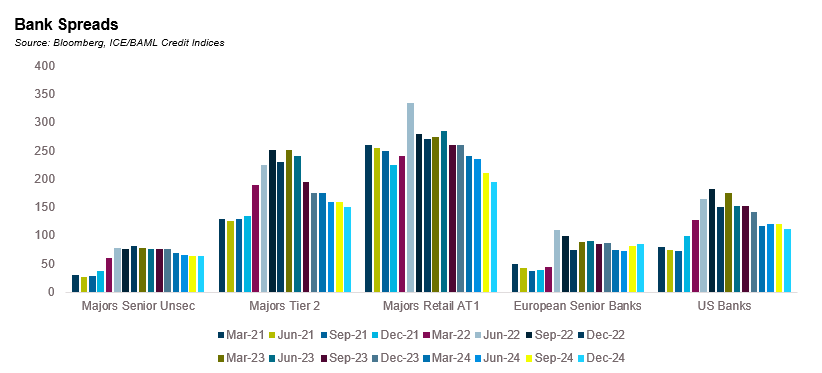
APRA’s decision to phase out the use of Additional Tier 1 capital instruments by banks was confirmed in December 2024. This will remove around A$43 billion of AT1 instruments over the next 7 years. AT1s will no longer count as capital from 1 January 2027. The price reaction was swift with investors moving to price AT1’s closer to Tier 2; the basis between Tier 2 and AT1 is now less than 50 basis points having averaged over 100 basis points for the last decade.
Most market participants below the additional Tier 2 supply will be manageable with minimal impact on Tier 2 or senior unsecured ratings with only NAB at risk of having a risk adjusted capital ratio of below the ranges prescribed by S&P. CBA estimates that Tier 2 supply will increase by around A$35 billion, or around 28% for the 5 major banks in Australia (Westpac, CBA, ANZ, NAB and Macquarie).
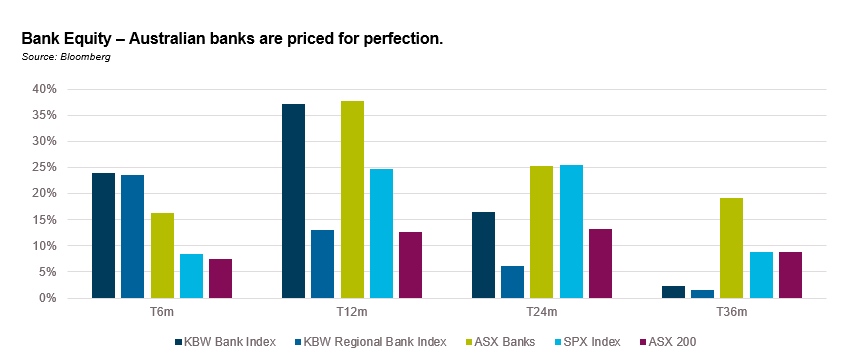
Domestic bank equity has had an outstanding year returning close to 40% in 2024 and close to 20% per annum over the last 3 years, double the return of the S&P 500 and more than 3 times the return on the KBW US bank index. Australian banks ended 2024 pricing at a multiple of 19 times earnings, an earnings yield of 5.2%. Contrast this with tier 2 debt which is pricing at a 5.5% yield to a 5 year call. We haven’t included European banks in the chart below; at forecast earnings multiples of below 10 (i.e. earnings yields of greater than 10%) they remain under valuation pressure despite returning 20% per annum over the last three years.
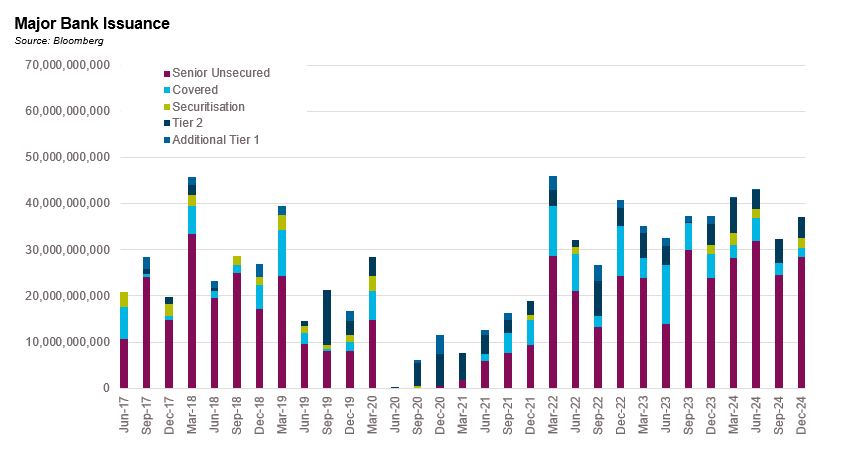
Issuance levels for the major banks have stabilised over the past two quarters in the A$30-40 billion territory. Tier 2 issuance was A$21 billion for 2024 which is in line with the most active year on record and compares to the A$14 billion issued in 2023 when spreads were wider. Note that this around 18% of total Tier 2 outstanding and 14% of the projected amount of Tier 2 required post the APRA changes. Even assuming no risk weighted asset growth, the major banks will need to average this amount of issuance in the coming years which may prove challenging if there is volatility in markets. Note also for every 1% in additional credit growth there is roughly $1.5 billion in additional Tier 2 issuance required. If banks average 5% annual credit growth for the next 5 years this would add another A$40 billion in Tier 2 issuance requirements.
Fundamental performance from the banking system in Australia has continued to weaken albeit at a slow pace. At the end of September 2024, 1.1% of loans were non-performing, 0.3% above the low from 2022 with the dollar amount of non-performing loans at A$47 billion, a A$1.2 billion increase over the quarter. Citigroup analysts expect a 70% increase in NPLs over the next 3 years implying an NPL ratio in the 1.6-1.7% range. In the United States, fundamental performance has started to stabilise with Q3 charge-offs flat to Q2 at 0.6%. Citi analysts are forecasting median large bank charge-offs to decline from 0.55% in 2024 to 0.47% in 2025. Delinquency rates on all loans ended the third quarter at 1.5%, slightly above Q2 at 1.44% but below the peak rate of 1.64% reached in the fourth quarter of 2020. European banks reported aggregate non-performing loans ratios at 2.31% at the end of the third quarter compared to 2.30% in Q2.
ABS & Whole Loans:
Summary views: relative value favours senior tranches of securitisations. Mezzanine tranches particularly domestically have rallied strongly reflecting strong collateral performance. Private markets continue to grow.
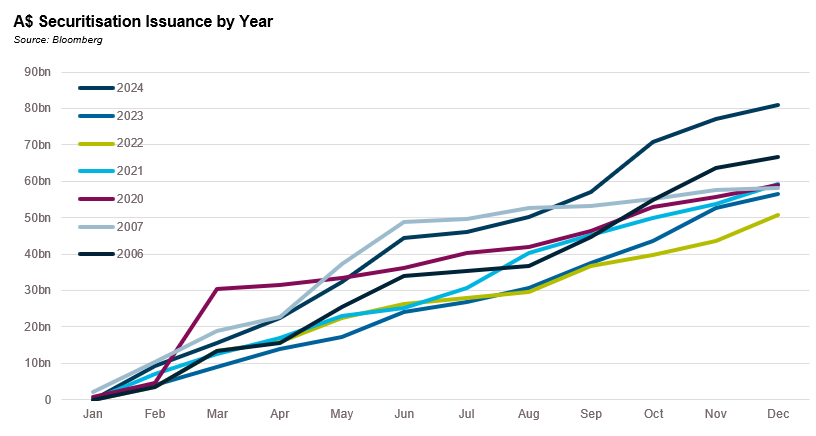
The Australian dollar securitisation market ended 2024 with over $80 billion in issuance taking the total amount of securitised credit outstanding to A$192 billion, around a 22% increase in the overall market size over the year. A trend we have highlighted in previous reports in the diminished role of banks in securitisation issuance and 2024 was no exception with 70% of total issuance coming from non-banks. This was slightly down on 2023’s record of 84% but well above GFC levels of around 30% and pre-COVID levels of circa 60%.
The net result of the increased role of non-banks has been more issuance in mezzanine notes and more non-residential collateral being issued. Roughly 40% of the securitisation market is secured by collateral other than residential mortgages. A$6.8 billion in A&NZ issuance in 2024 was not rated AAA taking the total market of non-AAA rated issues to A$18 billion. The sub-investment grade rated market is a fraction of the total market with A$1.1 billion issued in 2024 taking the total market to A$3 billion.
European markets saw record post-GFC volumes of €137 billion in gross issuance with €40 billion in net issuance. Collateralised loan obligations were the most dominant issuance type responsible for €48 billion in gross issuance and €25 billion in net supply. Net supply was also strong in asset backed markets but more neutral in residential mortgage backed securities and negative in commercial mortgage backed securities.
In the United States non-agency securitisation issuance was up 30% on 2023 with asset backed issuance of over US$300 billion followed by issuance of collateralised loan obligations of over US$180 billion. In 2025 Deutsche Bank expected $900 billion in gross issuance but “only” US$250 billion in net issuance with the strongest net growth in non-agency residential mortgage backed securities.
Collateral performance has remained good enough across most collateral types. Within Australia, non-conforming RMBS 30 days plus delinquencies have stabilised at around 4%, flat on a year on year basis, according to S&P SPIN data. S&P reported that auto ABS delinquencies did increase over the year with 30+ delinquencies ending November at 1.3% up 0.40% on a year on a year basis albeit they are below the February seasonal peak of 1.6%. These levels are well below the COVID peak of 2.5% in May 2020, itself a level of delinquency well below levels that would cause investors’ concern.
Fundamental performance in Europe has also moderately deteriorated with delinquencies ticking up in Irish re-performing and UK buy to let and non-conforming RMBS to levels slightly above COVID peaks. Auto ABS delinquencies have also ticked up to around 1% for 60 day delinquent loans, the highest levels since the middle of 2020. The story is similar in European CLOs with a small uptick in CCC buckets from c. 3% into the 5% area.
Collateral performance has generally been slightly better in the US reflecting the better conditions of the household balance sheet. Non qualifying RMBS delinquencies have increased above 3% but remain well below COVID peak levels in the double digits. Subprime autos have been an area of weakness with 60+ delinquencies just under 5%, only slightly higher over the year.
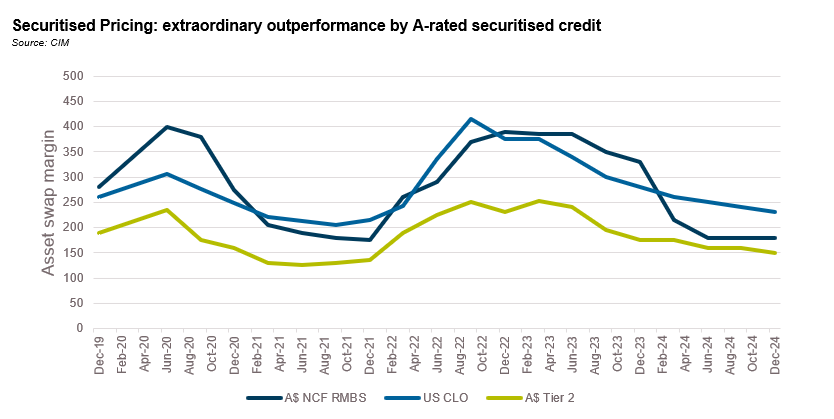
The real action in 2024 was in credit spread performance. Domestically spreads have significantly outperformed both corporates and offshore securitised products. Having started 2024 trading 50 basis points wide of US CLOs, Australian non-conforming A-rated RMBS now trades 50 basis points inside, a 100 basis point relative move.
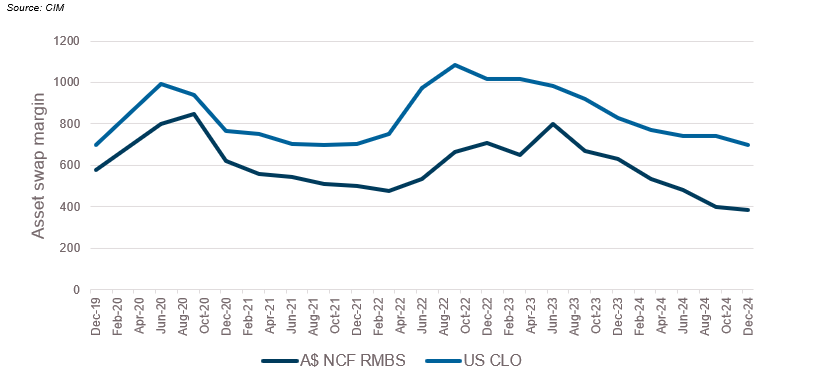
The spread moves in sub-investment grade securitised credit have also been significant in an absolute sense with BB-rated spreads halving over the last 18 months. Relative performance of Australia versus offshore has been less pronounced with spreads of other similarly rated securitised and corporate paper also performing strongly.
Securitised Pricing: outperformance less pronounced in BB-rated tranches.
Senior spreads on securitised paper continues to trail moves in mezzanine tranches. Pricing on AAA rated AUD denominated securitisations was flat over the quarter and is around 25 basis points tighter over the year, lagging CLOs which tightened by 40 basis points over the year.
Warehouse exposures of the major domestic banks increased by A$2.5 billion over the year with September 2024 ending slightly below the all-time peak of A$86 billion reached in December 2022. Over the quarter, November 2024 ended with loans made by Non-Bank Financial Institutions increased by 7% taking 1 year trailing growth to 17%, far outpacing bank lending growth of 6%.
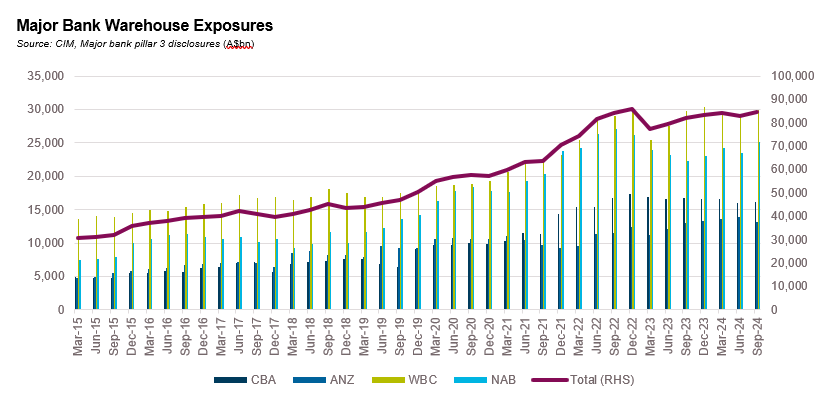
Reflecting the growth in the wider market, CIM’s pipeline of private asset backed opportunities has picked up considerably with increased diversity and scale of issuance.
Real Estate Loans:
Summary views: Fundamentals continue to be weak both domestically and offshore but offshore investors seem more alive to the risks. Private pipeline continues to steadily increase.
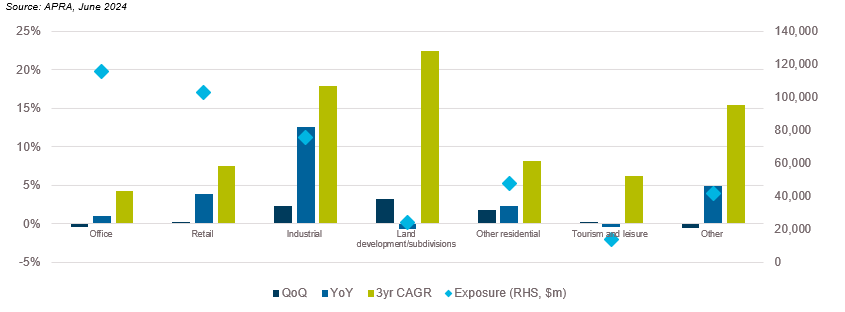
Domestic bank exposure to commercial real estate grew 2.6% in the September quarter. The pace of growth in exposures was faster than the growth in limits which only increased by 2.2%. Year on year growth in exposures was only around 6% suggesting much of the growth came in the September quarter.
The strongest growth came in retail exposures which were up 5.1% for the quarter. Over the year the strongest growth was in industrial loans, which increased by close to 14%. Weakest growth came from the Other category with land development/subdivisions also growing at a tepid pace (up less than 1% over the past 12 months). Banks still seem conservative on other residential loans with year on year growth in limits of 4%. This contrasts with a 10% increase in exposures, implying further drawdowns of existing limits.
Australian Bank Commercial Real Estate Lending Exposures
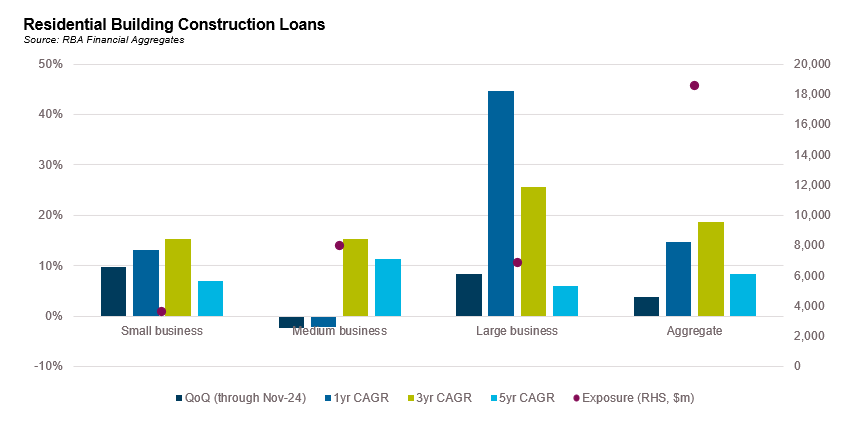
RBA data shows that lending to residential developments was up 15% on a year-on-year basis with aggregate exposure at $18.6 billion dollars, slightly below the peak of $18.8 billion in October 2024.
Asset quality of CRE loans continues to be a concern. In the September quarter, non-performing loans for Australian banks increased to 0.9% of total exposures, up 0.2% over the quarter. In the United States the delinquency rate for large banks increased to 1.9%, up 0.56% over the year and 0.11% over the quarter. Within CMBS markets the story is even more notable with office loans under significant stress. Trepp reported that in December the overall CMBS delinquency rate increased to 6.57% with the office delinquency rate increasing to 11.01%, the highest level since Trepp began reporting this statistic in 2000 (previous peak was 10.70% reached in December 2012). Despite this fundamental weakness, CMBS spreads performed well over the quarter tightening by close to 90 basis points to end the year at 148 basis points, the tightest level since mid-2022.
The private lending sector in Australia has continued to grow albeit at a more moderate pace than previous years, reflecting the growth in residential construction lending noted above. Alvarez & Marsal estimated that the CRE lending market in Australia had reached A$85 billion, up A$9 billion on the year. Slower growth may reflect burgeoning worries about asset quality and challenging financial conditions.
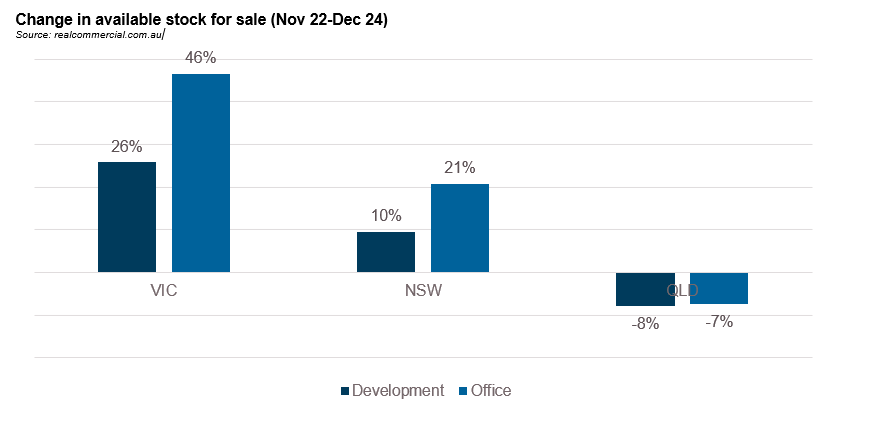
Over the past two years there has been a significant uptick in the available stock of sites for sale. Victoria appears to be ground zero for these concerns with the number of development sites for sale up 26% over the last 2 years and the number of offices for sale up 46%.
Press articles around CRE are also increasingly pointing to pressures in the sector. One private lender focussed on construction finance elected to cap a fund raise citing poorer prospective returns. Another warned investors that forecast returns on one of its funds had dropped from 18% to 3% due to the failure of one developer and the generally volatile market conditions. A third private credit manager enforced on a project with the senior financiers paid out by the equity of the same manager.
Despite these concerns investors still seem to be comfortable with the asset class with most funds reporting inflows and listed trusts trading at premiums or flat to net asset values. Globally investors seem more alive to the risks. Listed commercial mortgage REITs in the United States are trading at a 40% discount to book values which stands in stark contrast to the Australian experience. UBS is forecasting a 4% decline in the book value of mortgage REITs in 2025 following a 13% decline in 2024.
On behalf of the team, thanks for reading.
Pete Robinson
Head of Investment Strategy – Fixed Income | +61 2 9994 7080 | probinson@challenger.com.au
For further information, please contact:
Linda Mead | Senior Institutional Business Development Manager | T +61 2 9994 7867 | M +61 417 675 289 | lmead@challenger.com.au | www.challengerim.com.au
Disclaimer: The information contained in this publication has been prepared solely for solely for the addressee. The information has been prepared on the basis that the Client is a wholesale client within the meaning of the Corporations Act 2001 (Cth), is general in nature and is not intended to constitute advice or a securities recommendation. It should be regarded as general information only rather than advice. Because of that, the Client should, before acting on any such information, consider its appropriateness, having regard to the Client’s objectives, financial situation and needs. Any information provided or conclusions made in this report, whether express or implied, do not take into account the investment objectives, financial situation and particular needs of the Client. Past performance is not a guide to future performance. Neither Fidante Partners Limited ABN 94 002 895 592 AFSL 234 668 (Fidante Partners) nor any other person guarantees the repayment of capital or any particular rate of return of the Client portfolio. Except to the extent prohibited by statute, Fidante Partners or any director, officer, employee or agent of Fidante Partners, do not accept any liability (whether in negligence or otherwise) for any errors or omissions contained in this report.